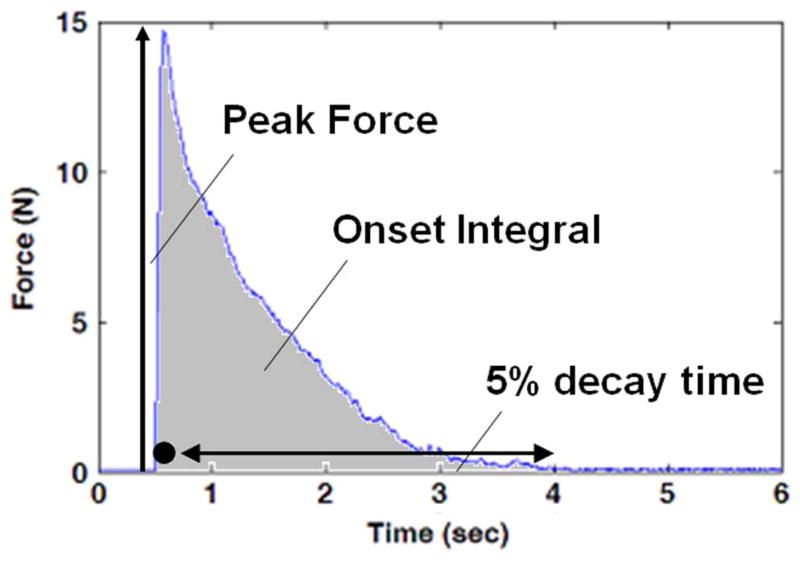
Fig. 1.
Typical gastrocnemius muscle force when HFAC is delivered to the sciatic nerve. Circle designates approximate timing of Phase I of the response. Double arrow designates approximate timing of Phase II of the onset response. Each of the three measures of onset response is schematically depicted in this trial plot.

