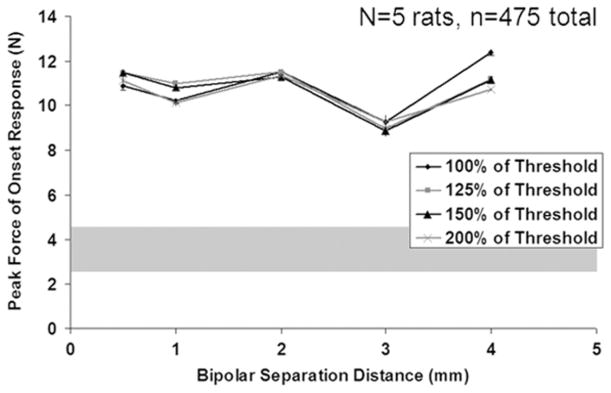
Fig. 5.
Peak force with bipolar separation distance and HFAC amplitude for the five rats (475 observations in total). Error bars represent the standard error of the mean (Note: standard deviation is √24 =~ 4.9 times larger than the SEM). The grey shaded region represents the approximate range of experimentally measured proximal twitch force.

