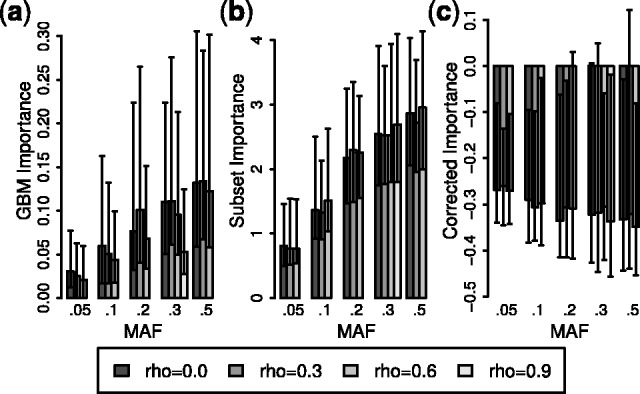
Fig. 2.

Median observed GBM variable importance by LD and MAF. Observed median importance is shown for GBM with (a) no correction, (b) LD subsetting and (c) LD subsetting and PCVs. The skewed distribution of importances makes SEs uninformative, so error bars instead indicate observed upper and lower quartiles. Differences within a value of MAF suggest an effect of LD, and differences at a correlation ρ suggest an effect of MAF
