
Fig. 3.
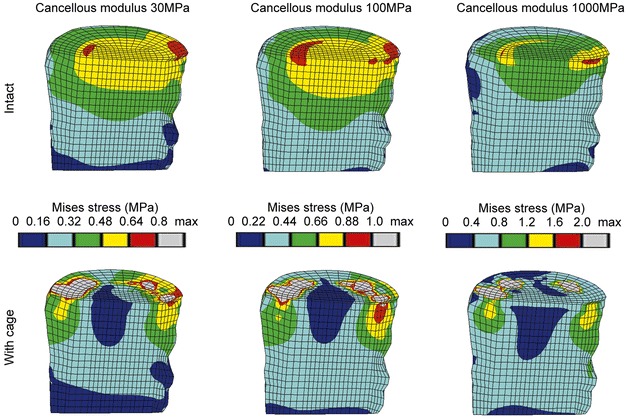
Von Mises stress distributions for intact cases (top row) and models with a titanium cage (bottom row) under uniform compression of 1000 N. A sagittal cut through the cancellous core of L3 is shown, anterior is to the left. The displayed limits for the colour bands are based on the intact case, please note that they are not identical