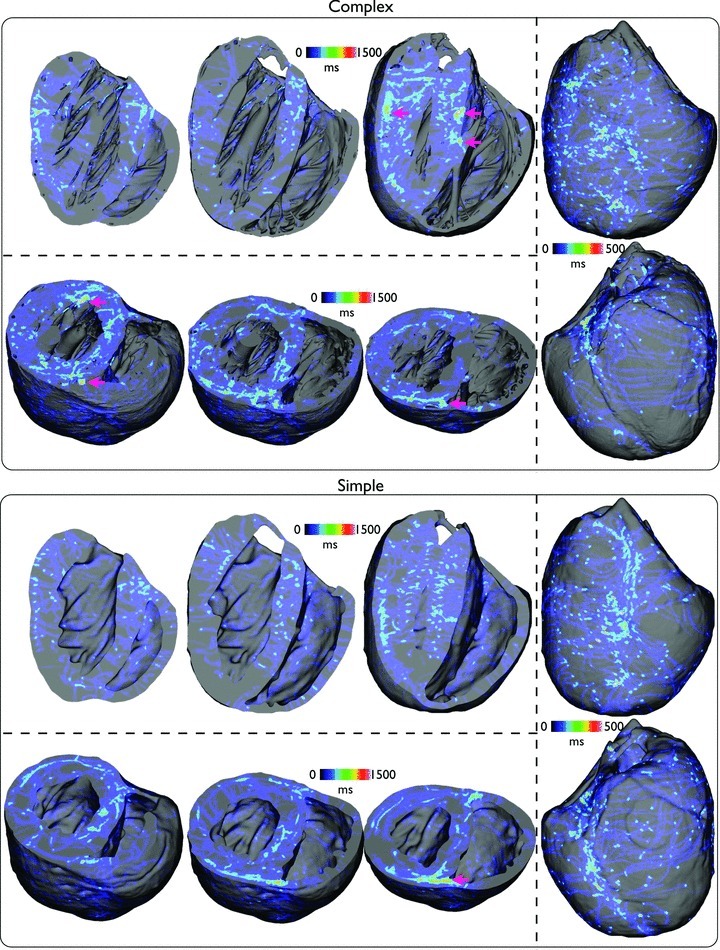
Figure 6. Spatial distribution of the cumulative temporal filament count, within the entire volume of the ventricles, accumulated over all 13 arrhythmia episodes for complex (top) and simple (bottom) models.

Plots are shown on anterior/posterior epicardial surfaces (right panel) and posterior views where longitudinal (top panel) and short-axis (bottom panel) clipping planes have been used to allow endocardial surfaces and intramural distributions to be viewed at different clipping locations through the ventricles.
