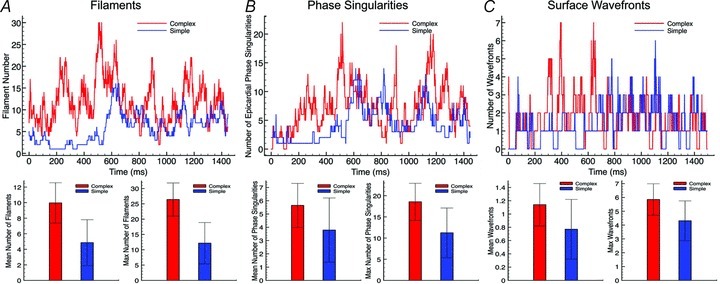
Figure 9. Quantitative analysis of 3D complexity metrics during fibrillatory activity.

Top panels, total number of filaments for episode CI = 225 ms (A), epicardial surface phase singularities for episode CI = 220 ms (B), and surface wavefronts within selected FOV (shown in Fig. 1) for episode CI = 225 ms (C) plotted over entire arrhythmia duration for complex (red) and simple (blue) models. Bottom panels, mean (left) and max (right) numbers of above plotted quantities averaged over all 13 arrhythmia episodes.
