
Figure 10.
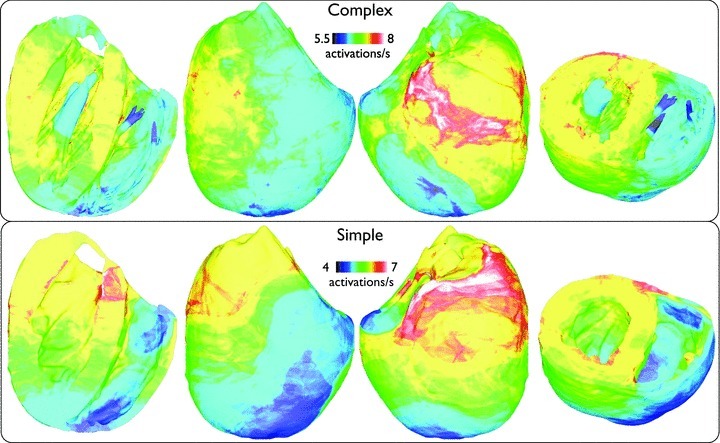
Spatial distribution of mean nodal activation rate (activations s−1), averaged over all 13 arrhythmia episodes, within the entire volume of the ventricles for fibrillatory activity with similar viewing angles to Fig. 5.
Official websites use .gov
A
.gov website belongs to an official
government organization in the United States.
Secure .gov websites use HTTPS
A lock (
) or https:// means you've safely
connected to the .gov website. Share sensitive
information only on official, secure websites.
Spatial distribution of mean nodal activation rate (activations s−1), averaged over all 13 arrhythmia episodes, within the entire volume of the ventricles for fibrillatory activity with similar viewing angles to Fig. 5.