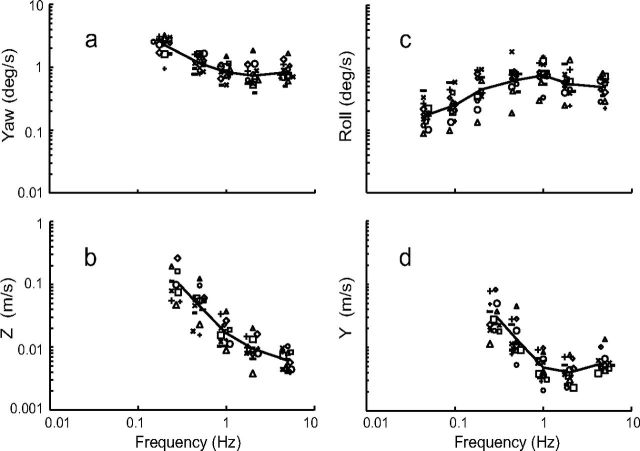
Figure 1.
Thresholds for 14 normal subjects are shown as a function of frequency; the geometric mean of the data is shown due to lognormal distribution of thresholds across subjects. (a) Yaw rotation, (b) z-translation, (c) roll-tilt, and (d) y-translation thresholds are plotted. Peak velocity at threshold is shown.

