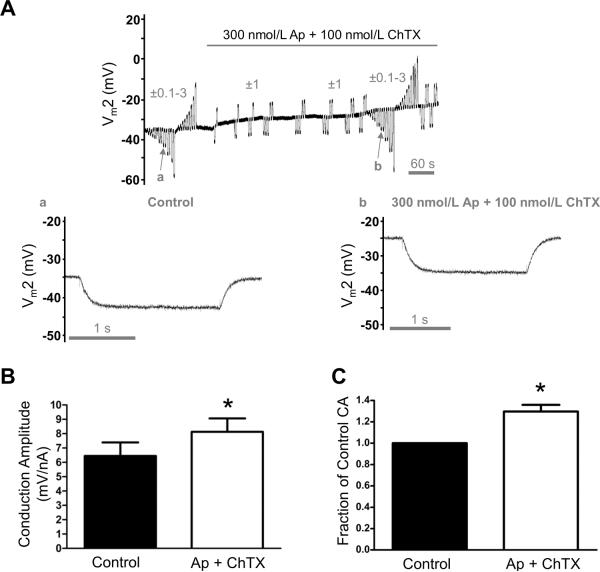
Figure 8. Enhanced electrical conduction during SKCa/IKCa blockade.
All data are from continuous (paired) recordings 500 μm from the site of current microinjection. A, Representative recording indicating Vm2 responses to ±0.1–3 nA microinjections before and during SKCa/IKCa block with Ap (300 nmol/L) + ChTX (100 nmol/L). Note depolarization (~10 mV) and increases in Vm2 responses during Ap + ChTX. a and b correspond to arrows in A and illustrate Vm2 responses to −1 nA injected at Site 1 during Control and subsequent exposure to Ap + ChTX: ΔVm2 was −8 mV in a and −10 mV in b. Records are from EC tube with resting Vm = −34 mV to illustrate depolarization and increased CA associated with blocking SKCa/IKCa. B, Summary data (means ± S.E.) for Control and with Ap + ChTX. C, Data from B expressed as Fraction of Control Conduction Amplitude (= CA during Ap + ChTX /Control CA) to illustrate relative effect of SKCa/IKCa inhibition. *Significantly different from Control, P < 0.05 (n = 6).

