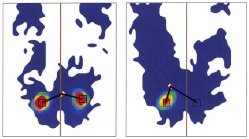
Fig. 2.
Calculation of the CoF Asymmetry for two subjects. This asymmetry index is a function of the distance from each side’s peak pressure location to the overall center of pressure. The image on the left shows a subject with near-perfect symmetry (CoF Asymmetry <0.01) and the image on the right shows a person with much less symmetry (CoF Asymmetry ≈0.31)

