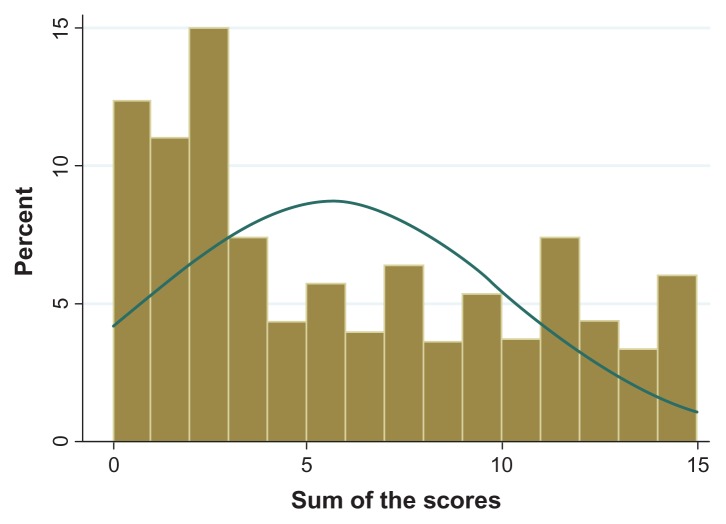
Figure 1.
Distribution of diabetes knowledge among the Karen ethnic rural community.
Notes: Overall knowledge level was sorted to be a sum of scoring in the histogram, to show the distribution of knowledge. The kurtosis was significant (P < 0.001) and the distribution was totally skewed to the left (P < 0.001). The histogram shows the sum of scoring had a peak around zero to three. The peak score around zero indicated that there were a large proportion of participants who could not correctly answer the questions.

