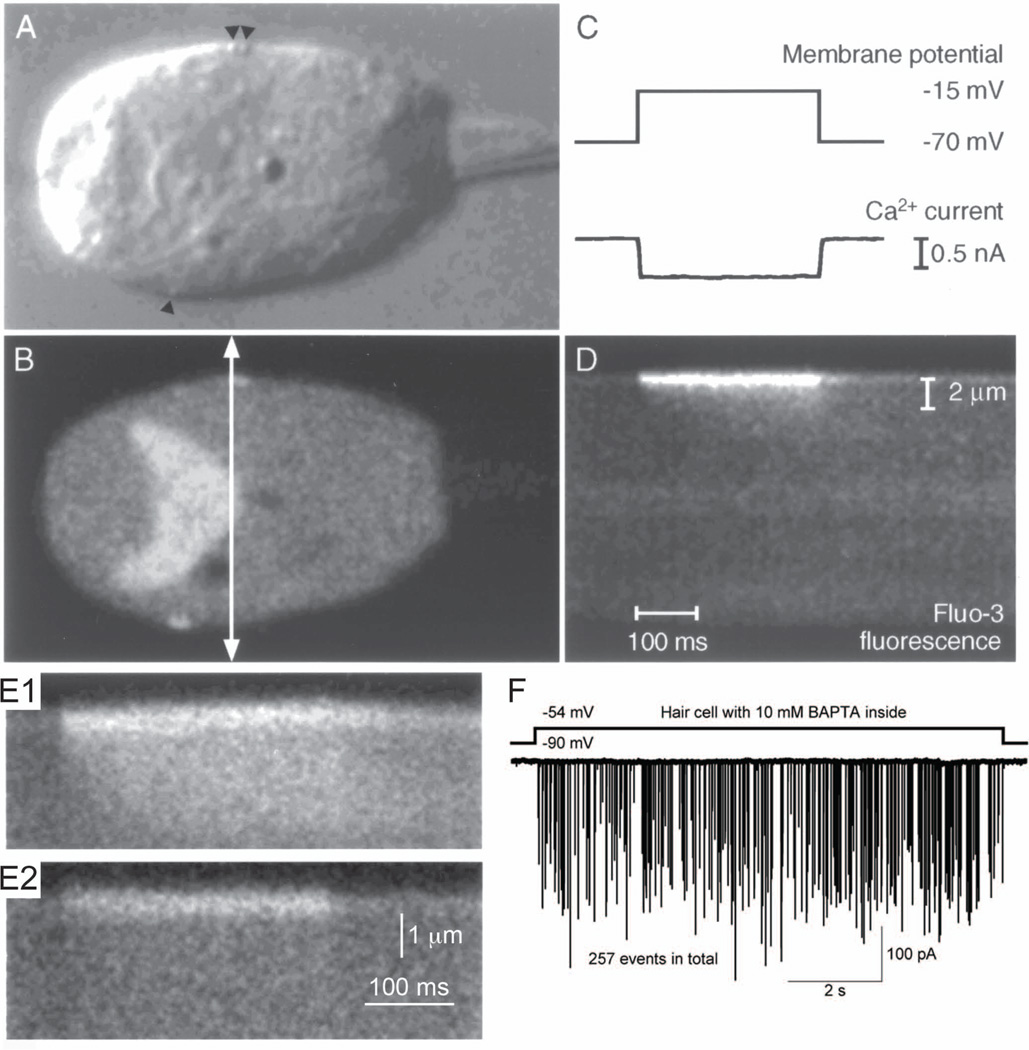
Figure 3.
Presynaptic Ca2+ entry in frog hair cells.
A. Image of a hair cell using differential interference contrast light microscopy. Arrowheads indicate the locations of presynaptic ribbons.
B. Epifluorescence image of the same hair cell with A, which is loaded with 200 µM fluo-3. The fluorescence image shows strong fluorescence signals at the positions of ribbons. The arrow indicates the transect scanned in D.
C. While the image was acquired, the hair cell was depolarized from −70 mV to −15 mV for 300 ms (upper trace). Ca2+ current was evoked by this stimulus (lower trace).
D. Time course of Ca2+ entry in isolated hair cell loaded with 200 µM fluo-3. The line-scan feature of a laser-scanning confocal microscope with high temporal resolution generated a two-dimensional image. One axis is distance and the other axis is time. A transect (400 nm) across the hair cell (arrow in B) was repeatedly scanned every 2 ms for a period including the depolarization in C. Within a few milliseconds of a depolarization’s onset, fluorescence signals increased in restricted region, which was close to the presynaptic membrane, then signals spreaded gradually to the inside of the cell. The spatial scale bar in D applies to A and B. The temporal scale bar in D applies to C.
E. Mobile Ca2+ buffer affects temporal and spatial changes in fluo-3 fluorescence. Hair cells were loaded with 200 µM fluo-3 (E1) or 200 µM fluo-3 plus 10 mM BAPTA (E2). The spread of Ca2+ was restricted to the presynaptic dense body by high concentration of mobile Ca2+ buffer (E2).
A – E: isolated frog saccular hair cells (modified from Issa and Hudspeth, 1996 [40]).
F. EPSCs from paired recordings from the bullfrog amphibian papilla hair cell synapse. Presynaptic hair cell dialyzed with 10 mM BAPTA was depolarized from −90 mV to −54 mV. The afferent fiber shows large amplitude EPSCs during the depolarizing pulse. Modified from Graydon et al., 2011 [6].

