Figure 1.

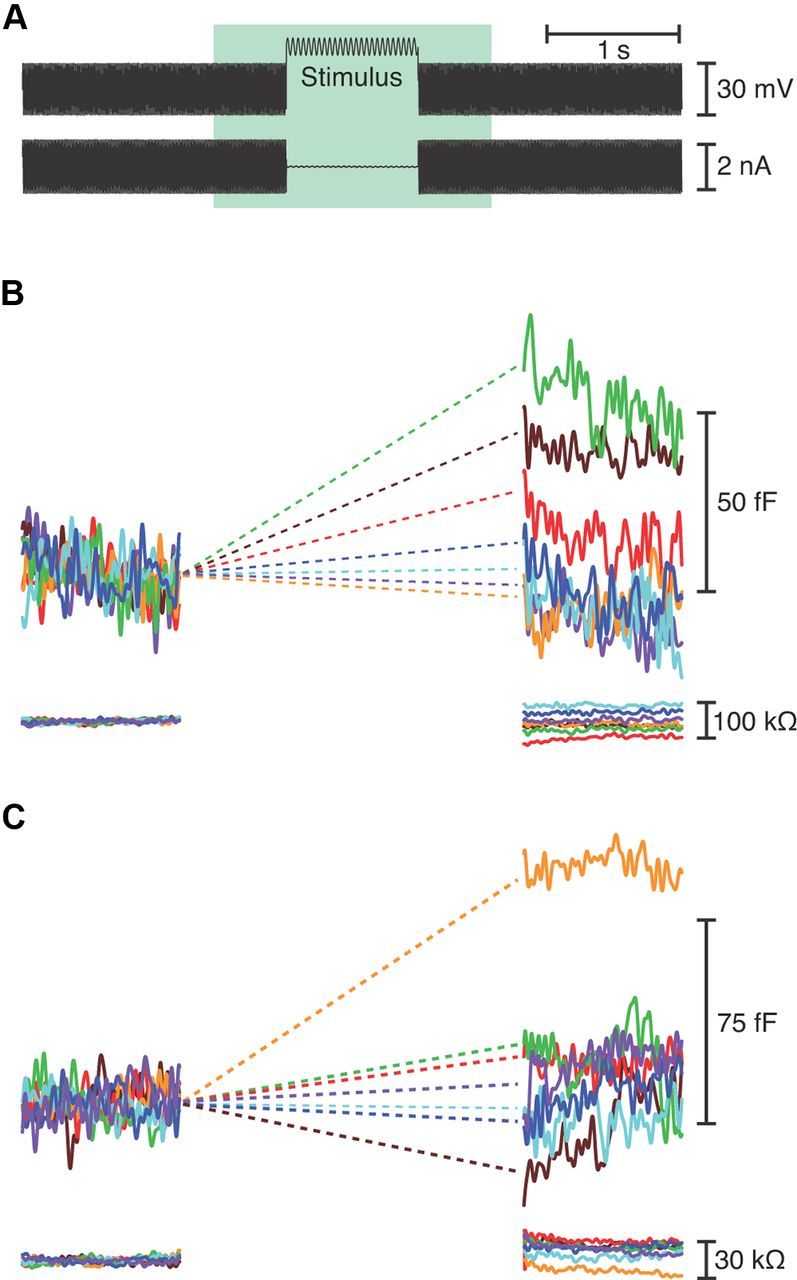
Measurement of capacitance changes resulting from exocytosis. A, The upper trace depicts the voltage-clamp protocol used during whole-cell recording in the perforated-patch configuration. A hair cell was held at −80 mV and exposed to a sinuosidal voltage change of ±15 mV at 1500 Hz to measure its membrane capacitance. In the segment labeled Stimulus, the cell was typically depolarized to −55 mV and the capacitance probe was interrupted by a 1 s sinusoidal stimulus at one of seven randomly presented frequencies, usually a constant value, 25, 200, 400, 600, 800, or 1000 Hz. The whole-cell current is shown in the lower trace. B, The upper trace depicts the cell's membrane capacitance, which was averaged over the 200 ms interval immediately before and after stimulation to calculate the capacitance change at the relevant frequency. Increasing frequencies are represented in spectral order. This hair cell, from the mid-frequency region of the papilla, displayed the greatest synaptic exocytosis during stimulation at 400 Hz (green). The lower trace confirms that the access resistance remained stable. C, A rostral cell stimulated at a holding potential of −45 mV showed greatest exocytosis at 300 Hz (orange). Responses to the frequencies used for this cell (100–700 Hz) are shown in spectral order.
