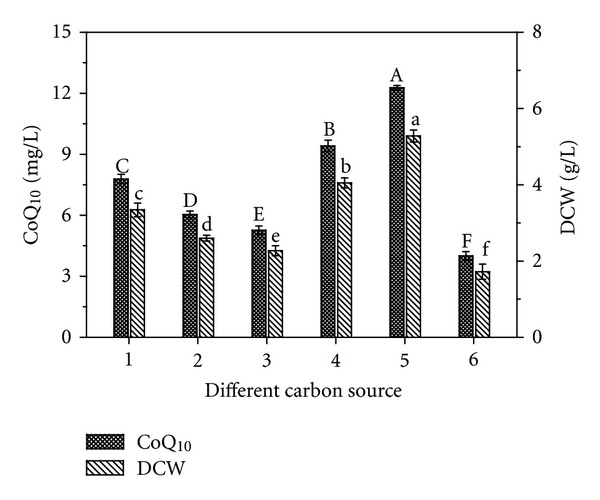
Figure 3.

Effect of various carbon sources on the cell growth and CoQ10 production. Cells were cultivated in the test tube at 28°C for 72 h. The carbon sources included glucose (1), fructose (2), lactose (3), maltose (4), sucrose (5), and xylose (6). Data are shown as mean ± SD (n = 3). Means with the same letter are not significantly different (P < 0.05).
