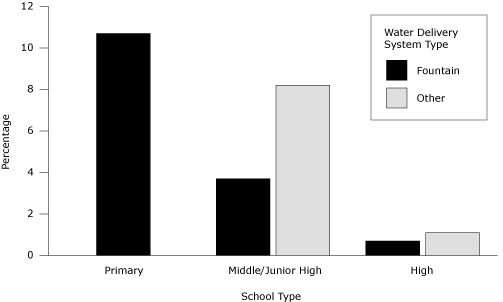
Figure 1.
Percentage of students (n = 11,226) observed drinking free water at lunch, by school type and water delivery system, Bay Area, California, 2011. The percentage of students drinking water at lunch was obtained by counting the number of students who drank water in the food service area divided by the total daily student attendance. There were no nonfountain sources of drinking water in primary schools. The percentage of middle school students who drank water from a fountain source was significantly lower than the percentage of students who drank water from a nonfountain source (P = .04). This difference was not significant among high school students (P = .09). The percentage of students drinking water at lunch was higher when water was available via a delivery system other than a drinking fountain (eg, water dispenser with cups).
| School Type | No. (%) of Students Accessing Water Delivery System |
|
|---|---|---|
| Fountain | Othera | |
| Primary | 246 (10.7) | NA |
| Middle/junior high | 72 (3.7) | 116 (8.2) |
| High | 24 (0.7) | 22 (1.1) |