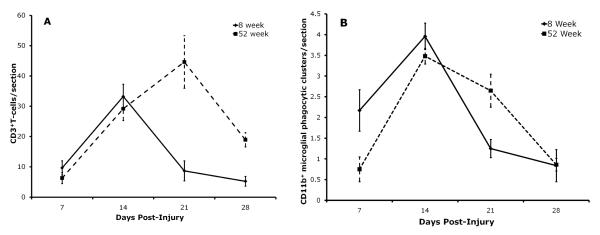
Figure 1.
Comparison between the 8 week old (solid line) and the 52 week old (dashed line) subject groups for the kinetics of 1). CD3+ T lymphocyte trafficking into the injured FMN (A), and; 2) neuronal death represented by CD11b+ perineuronal microglial phagocytic clusters in the injured FMN (B). Each time point represents the mean ± S.E.M. of 8 mice in the 8 week group and 6 mice in the 52 week group.

