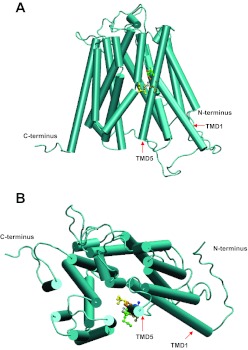
Fig. 7.
A homology model of PCFT showing transmembrane domains (TMD), COOH and NH2 termini, and the locations of the I188, V190, A191, G192, and M193 residues. A: lateral view of the carrier. B: view looking into the aqueous translocation pathway from the extracellular compartment. I188, yellow; G189, grey; V190, brown; A191, blue; G192, orange; and M193, green.

