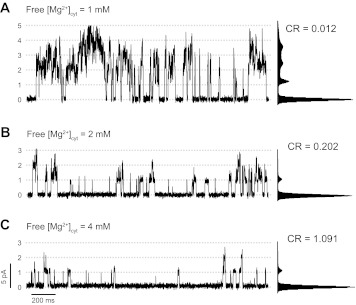
Fig. 4.
Effect of cytosolic Mg2+ on coupled RyR1 gating. A: representative trace taken from a recording of a group of 5 coupled RyR1s in the presence of cytosolic Ca2+ (100 nM), ATP (5 mM) and Mg2+ (5.6 mM; free Mg2+ ∼ 1 mM); Vm = 0 mV. B and C: recordings of the same group of channels after increasing the concentration of cytosolic free Mg2+ to ∼2 and ∼4 mM, respectively. Corresponding amplitude distribution histograms and CR values are shown next to each trace.

