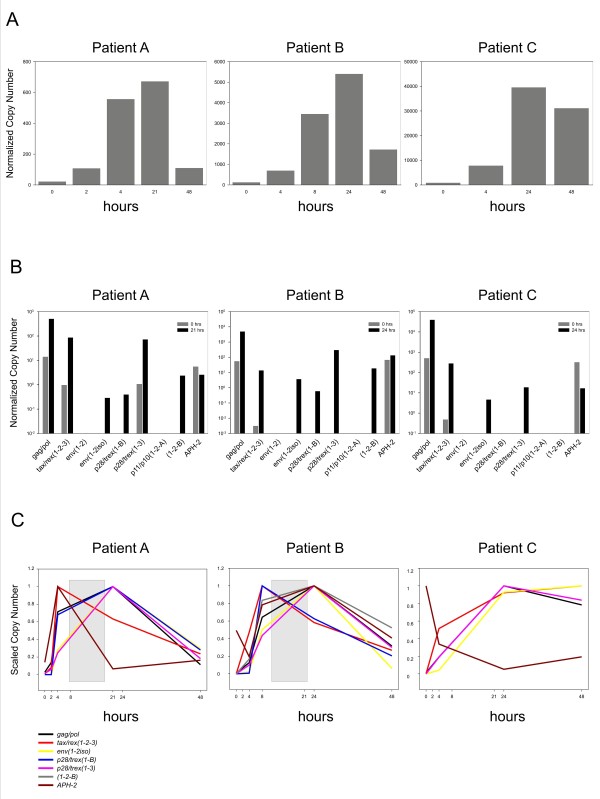
Figure 4.
Temporal analysis of HTLV-2 expression in PBMCs from infected patients. Normalized copy number (NCN) and Scaled Copy Numbers (SCN) were calculated as described in the text. The housekeeping gene used for the normalization was 18S rRNA and the resulted NCN was multiplied for 107. A. NCN of the sum of all viral mRNAs (plus- and minus- strands) viral mRNAs in PBMCs from infected patients in a 48-h time course of culture in vitro. PBMCs were cultured and harvested for total RNA at the indicated time points. B. NCN of the individual mRNAs in HTLV-2-infected patients at time 0 (grey bars) and after 21 (patient A) or 24 (patients B and C) hours of culture (black bars). C. SCN of individual mRNAs are plotted over a 48-h time period. The grey box in the figure, highlights the switch in the pattern of expression from early to late transcripts.

