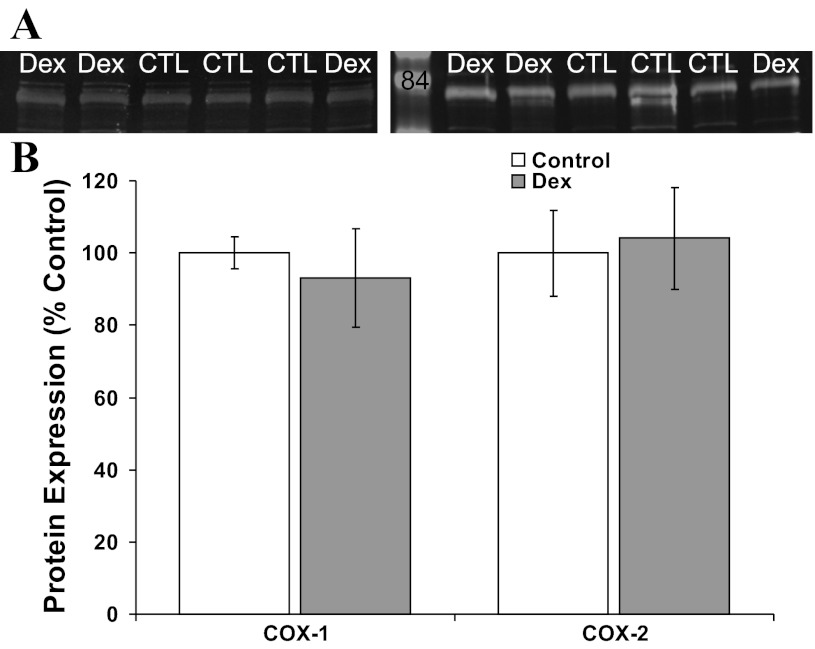
Fig. 6.
Western blot analysis for COX expression by coronary smooth muscle cells cultured from Dex and control (CTL) sheep. A: representative immunoblots probed with antibodies against COX1 (left) and COX2 (right) identify bands just below the labeled 85-kDa molecular mass marker (molecular mass markers at 105 and 50 kDa are seen at the top and bottom of the blot). There were no significant differences in COX expression between control (open bars, N = 6) and Dex-exposed sheep (shaded bars, N = 6) (B).

