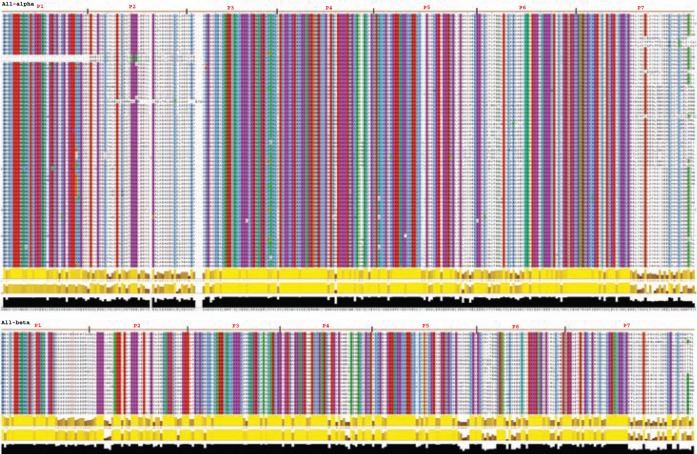
Figure 10.
Conservation at different isoform level is shown, the quasi-repeats are marked above the alignment and the P2 which was found to be highly variable in α sequences are highlighted.
Note: The conserved region is brightly coloured whereas the variable region is not coloured (Jalview colouring: clustalX + 90% conservation).

