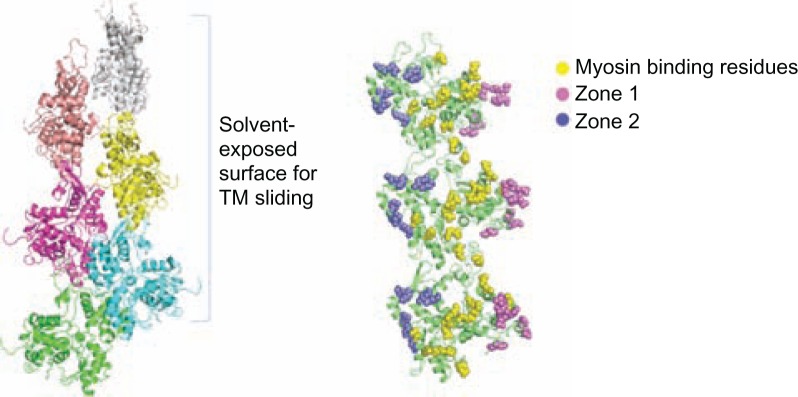
Figure 3.
F-actin structure from the cardiac thin filament model and the predicted charged zones on the surface of actin filament.
Notes: The two zones are present on either side of myosin binding residues. [Zone 1: D1, D2, E3, E4, R95, E100, E363, E364, K373; Zone 2: K215, E214, D222, E224, E226, K238, E237, E241, D244, K315]. The view of the actin filament on the right is rotated 90 degrees from the view on the left, and the actin monomers are recolored green.

