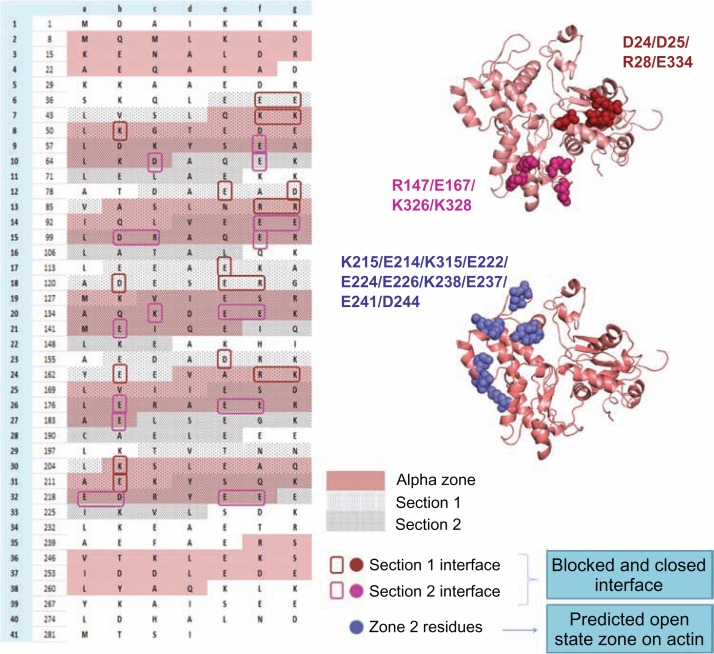
Figure 5.
The probable actin-tropomyosin interface in the three states (B-, C-, M-states) is shown systematically.
Notes: In the left side the Tm sequence is represented based on their heptad pattern and the pink shaded region is the α zone of each quasi-repeat. Each quasi-repeat is divided into two sections (section 1 and 2-dotted regions) and the probable interface residues which may interact with actin at the blocked and closed states are boxed with different colours. In the right side F-actin structure with mapped interface residues at the three states are displayed. Actin interface residues at blocked and closed states are found to be common but the strength of interaction with the Tm residues differs in both the states. In the blocked state section 1 and section 2 forms strong interactions. But in the closed state section 1 becomes weaker but section 2 is still stronger in its interaction with actin. The predicted open state interface of actin consists of the zone 2 residues, and the charged residues from section 1 of each quasi-repeat contribute for the Tm interface. The periods 1 and 7 are not considered for the study.

