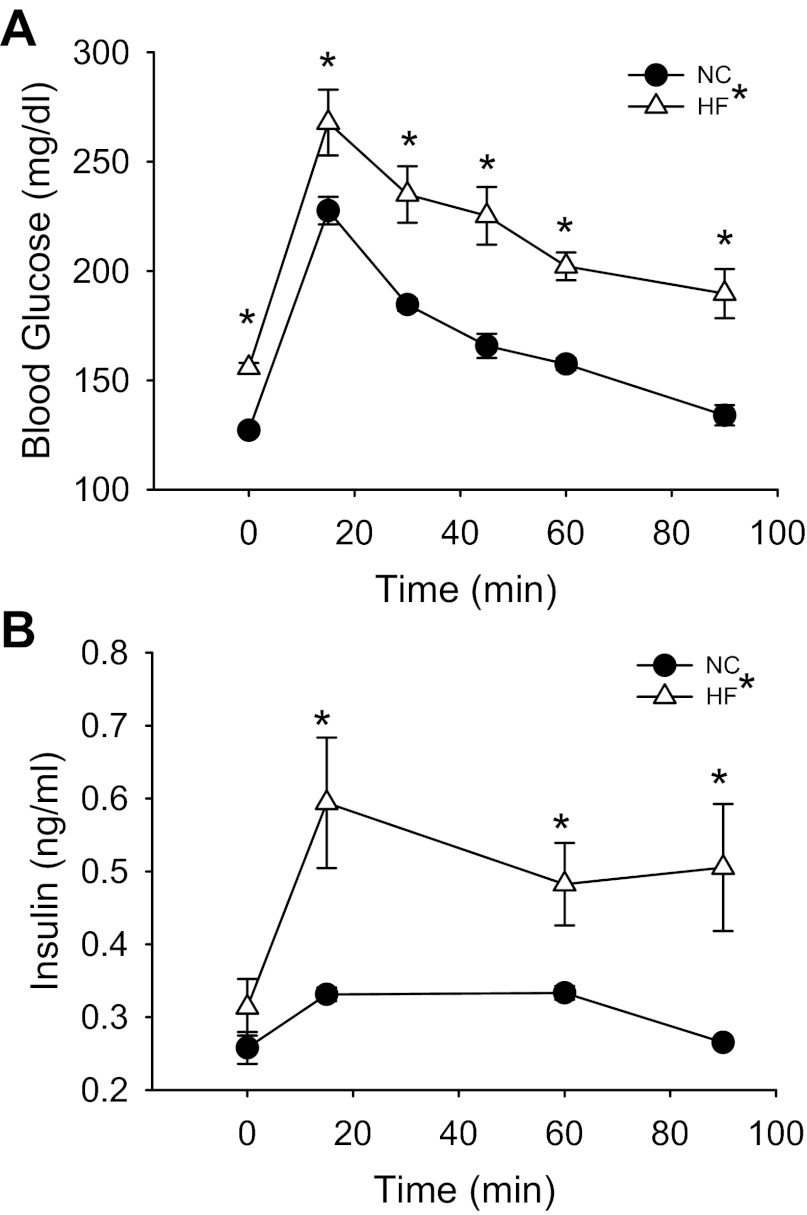
Fig. 1.
Blood glucose concentrations (A) after a 2-h morning fast (time 0) and during an intraperitoneal glucose (2,000 mg/kg) tolerance test (GTT) in normal chow (NC; N = 7)- and high-fat (HF; N = 8)-fed mice. Plasma insulin concentrations (B) after 2-h fast (time 0) and during ip GTT are also shown. Significance marks in legend denote a time by group interaction or main effect for diet during repeated-measures ANOVA. Marks above curves indicate difference between groups at specific time points by 1-way ANOVA. *Differences between NC- and HF-diet groups. Data are means ± SE (P ≤ 0.05).

