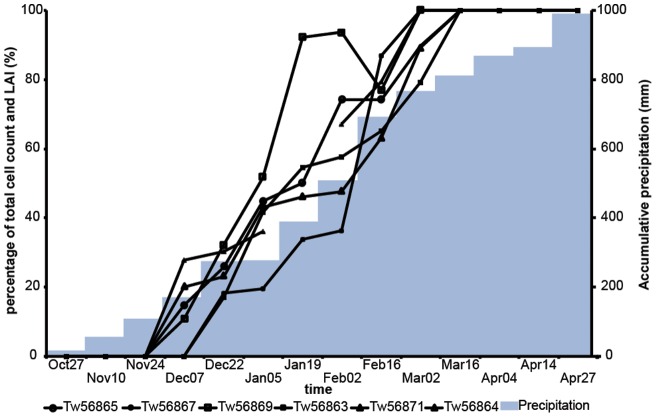
Figure 4. Cumulative xylem formation, and precipitation throughout the growth season.
Median percentage of maximum cell counts in 6 Brachystegia spiciformis trees (thin solid lines) and cumulative precipitation (gray bars) at Kataba Forest Reserve at bi-weekly intervals between October 27, 2001 and April 27, 2002. The apparently negative growth recorded in Tw56869 on February 16 can be explained by variation in the strength of cambial activity around the circumference of the tree.

