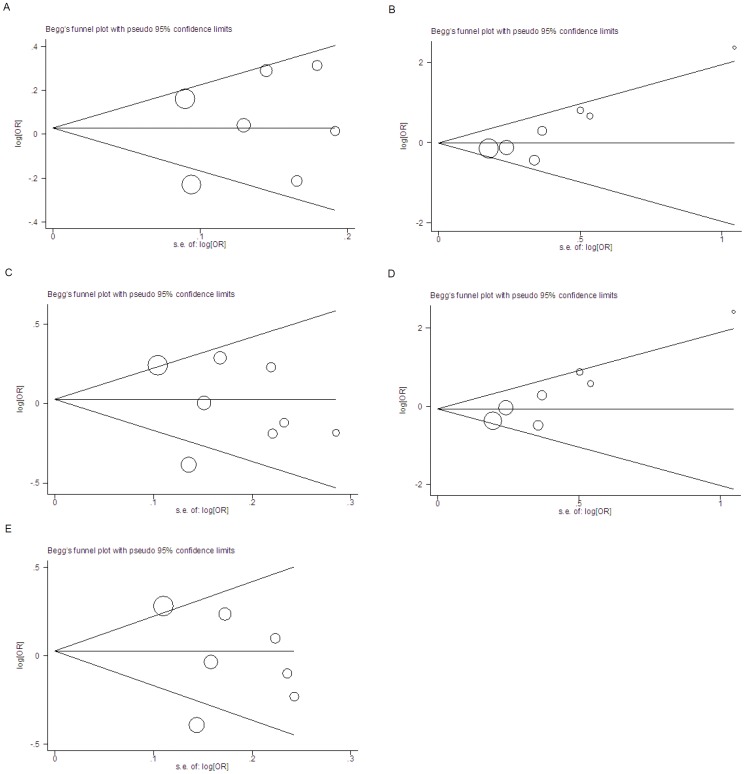
Figure 3. Begg’s funnel plot of publication bias with pseudo 95% confidence limits.
The horizontal line in the funnel plot indicates the random effects summary estimate, while the sloping lines indicate the expected 95% confidence intervals for a given standard error, assuming no heterogeneity between studies. Each study is represented by a circle, the area of which represents the study’s precision. A, Additive model (Egger’s test P = 0.643). B, Recessive model (Egger’s test P = 0.020 ). C, Dominant model (Egger’s test P = 0.519). D, AA versus GG (Egger’s test P = 0.014). E, GA versus GG (Egger’s test P = 0.429).

