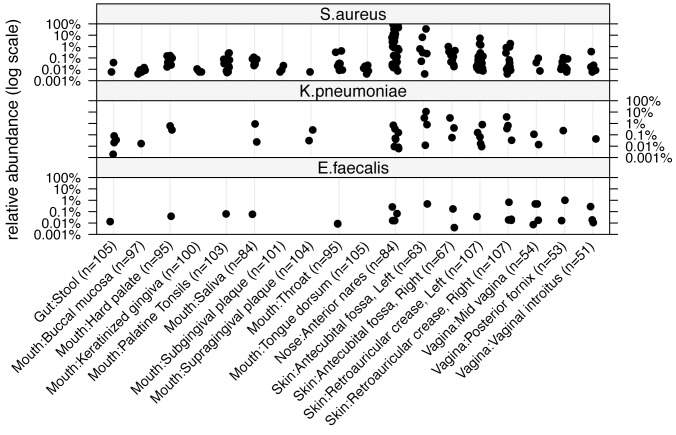
Figure 3. Relative abundance of S. aureus, K. pneumoniae and E. faecalis across body sites and individuals.
Each point represents the relative abundance of an organism for an individual's first sampling visit. Relative abundances are shown on a log scale. Samples along the x-axis are described by general and specific body site.

