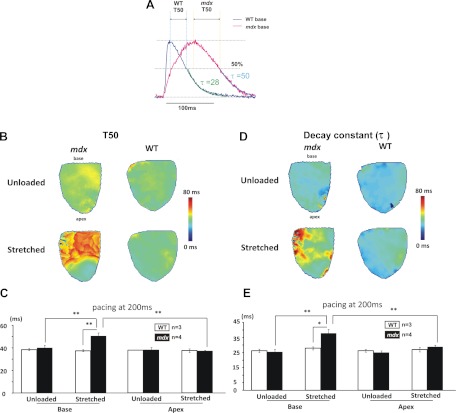
Fig. 5.
Calcium relaxation for mdx and WT. A: representative calcium transients at the base of a WT (blue line) and a mdx (red line) heart. Signals were averaged from adjacent 25 charge-coupled device elements. Definitions of T50 and decay constant τ are illustrated. B and C: representative T50 and decay constant maps in a mdx and a WT heart under unloaded vs. stretched condition. D and E: under unloaded conditions, both T50 and decay constant were comparable between mdx and WT hearts. Ventricular stretch caused regional increases of T50 and decay constant at the base of mdx hearts. However, WT hearts exhibit similar T50 and decay constant. *P < 0.05; **P < 0.01.

