Abstract
In the present study, we evaluated the effect of inhibition of renin activity (aliskiren) on the progression of renal lesions in two different mouse models (Vpr and Tg26) of human immunodeficiency virus (HIV)-associated nephropathy (HIVAN). In protocol A, Vpr mice were fed either water (C-VprA) or doxycycline [Doxy (D-VprA)] in their drinking water for 6 wk. In protocols B and C, Vpr mice received either normal saline (C-VprB/C), Doxy + normal saline (D-VprB/C), or Doxy + aliskiren (AD-VprB/C) for 6 wk (protocol B) or 12 wk (protocol C). In protocols D and E, Vpr mice were fed Doxy for 6 wk followed by kidney biopsy. Subsequently, half of the mice were administered either normal saline (D-VprD/E) or aliskiren (AD-VprD/E) for 4 wk (protocol D) or 8 (protocol E) wk. All D-VprA mice showed renal lesions in the form of focal segmental glomerular sclerosis and dilatation of tubules. In protocols B and C, aliskiren diminished both progression of renal lesions and proteinuria. In protocol C, aliskiren also diminished (P < 0.01) the rise in blood urea. In all groups, Doxy-treated mice displayed increased serum ANG I levels (the product of plasma renin activity); on the other hand, all aliskiren-treated mice displayed diminished serum ANG I levels. Renal tissues of D-VprC displayed increased ANG II content; however, aliskiren attenuated renal tissue ANG II production in AD-VprC. In protocol D, AD-VprD showed a 24.2% increase in the number of sclerosed glomeruli compared with 139.2% increase in sclerosed glomeruli in D-VprD (P < 0.01) from their baseline. The attenuating effect of aliskiren on the progression of renal lesions continued in AD-VprE. Aliskiren also diminished blood pressure, proteinuria, and progression of renal lesions in Tg26 mice. These findings indicate that inhibition of renin activity has a potential to slow down the progression of HIVAN.
Keywords: glomerulosclerosis, angiotensin II, microcysts, human immunodeficiency virus
the role of the renin-angiotensin system (RAS) in the development and progression of chronic kidney disease in general and human immunodeficiency virus (HIV)-associated nephropathy (HIVAN), in particular, has been increasingly recognized (7, 30, 37). The first step in the RAS cascade is the release of renin from juxtaglomerular cells in the kidney (1). Renin is formed by the removal of a 43 amino acid peptide from its precursor, pro-renin (1), and stored in secretory granules of juxtaglomerular cells. Its release is dependent on several variables, including renal perfusion pressure, distal tubular cell chloride content, and sympathetic nerve burst (2). Angiotensin (ANG) II, vitamin D (23), uric acid (26), transforming growth factor-β (10), and tumor necrosis factor-α (37) also modulate renin release as well as its expression. Renin acts on both systemic and tissue angiotensinogen to form ANG I. The latter is cleaved into an octapeptide, ANG II, by membrane bound ANG I-converting enzyme (ACE; Ref. 2).
Currently, ACE inhibitors and ANG II type 1 receptor blockers (ARBs) are employed as the standard therapy to slow down the progression of chronic kidney diseases including HIVAN (4, 6, 7, 30, 37). Nevertheless, ACE inhibitors and ARBs stimulate a compensatory increase in plasma renin activity that may compromise some of the beneficial effects of these agents (37). Therefore, strategies that fully suppress the RAS in HIVAN are being explored (37). Direct renin activity inhibition represents a novel and potentially more effective way to inhibit the RAS. Moreover, inhibition of plasma renin activity will not allow activation of the RAS. Therefore, we hypothesized that renin inhibition would slow down the progression of HIVAN. In the present study, we have utilized aliskiren, an inhibitor of renin activity, to modulate the progression of HIVAN in two different mouse models.
MATERIALS AND METHODS
Vpr Transgenic Mice
We have used age- and sex-matched FVB/N (control) and Vpr (with FVB/N background) mice. Breeding pairs of FVBN mice were obtained from Jackson Laboratories (Bar Harbor, ME). Breeding pairs to develop Vpr colonies were kindly gifted by Dr. J. B Kopp (National Institutes of Health, Bethesda, MD). We have generated Vpr transgenic animals by crossing podocin/rtTA mice (constitutively expresses the rtTA, which is a fusion protein comprised of the TetR repressor and the VP16 transactivation domain from the podocin promoter) with tetop/Vpr mice (TRE-regulated Vpr gene). These animals were given doxycycline (Doxy) in their drinking water to induce the expression of the podocyte-specific Vpr gene.
The inheritance of the transgenes (tetop/vpr and podocin/rtta) was determined by PCR, which was performed using the following primers: forward, CGCCTGGAGACGCCATCC; and reverse, CCACACCTCCCCCTGAAC. The Vpr mouse model is well characterized and has been used in multiple studies to explore the mechanisms involved in HIVAN (9, 15, 19, 20, 24, 34). We (22) have recently described the detailed morphology and characteristics of renal lesions in this model. These mice do not have any specific phenotype and develop renal lesions only after ingestion of Doxy.
HIV Transgenic (Tg26) Mice
We have used age- and sex-matched FVB/N (control) and Tg26 (with FVB/N background) mice. Breeding pairs of FVBN mice were obtained from Jackson Laboratories. Breeding pairs to develop Tg26 colonies were kindly gifted by (Dr. P. E. Klotman, Baylor College of Medicine, Houston, TX). The Tg26 transgenic animals have the proviral transgene pNL4–3:d1443, which encodes all the HIV-1 genes except gag and pol, and therefore the mice are noninfectious (20, 24). We are maintaining colonies of these mice in our animal facility. For genotyping, tail tips were clipped, DNA was isolated, and PCR studies were carried out using following primers for Tg26: HIV, forward, 5′-ACATGAGCAGTCAGTTCTGCCGCAGAC; and HIV, reverse, 3′-CAAGGACTCTGATGCGCAGGTGTG. Tg26 mice develop proteinuria and renal lesions at the age of 4 wk. This model has been used by several investigators to evaluate the therapeutic strategies in HIVAN (20, 24). The Ethics Review Committee for Animal Experimentation of Long Island Jewish Medical Center approved the experimental protocol.
Experimental Studies
Protocol A.
Vpr mice in groups of six (aged 6 wk) were given either normal drinking water or drinking water containing Doxy for 6 wk.
Protocol B and C.
Vpr mice in groups of six (aged 6 wk) received either Doxy in their drinking water + normal saline (miniosmotic pump) or Doxy in their drinking water + aliskiren (50 mg·kg−1·day−1, by miniosmotic pump) for 6 (protocol B) or 12 (protocol C) wk. To place the placement of miniosmotic pumps, mice were administered inhalation anesthesia (isoflurane + oxygen). The Alzet minipump (model no. 2004; Durect, Cupertino, CA) containing either aliskiren in saline or saline alone was implanted subcutaneously. The miniosmotic pump delivered aliskiren or normal saline subcutaneously at a rate of 0.25 μl/h.
Protocol D.
A total of 12 (aged 6 wk) Vpr mice were fed Doxy for 6 wk followed by kidney biopsy for confirmation of the development of HIVAN and baseline kidney lesions. Subsequently, mice in groups of six were administered either normal saline or aliskiren (50 mg·kg−1·day−1, by miniosmotic pump) for 4 wk.
Protocol E.
A total of 12 (aged 6 wk) Vpr mice were fed Doxy for 6 wk followed by kidney biopsy for confirmation of the development of HIVAN and baseline kidney lesions. Subsequently, mice in groups of six were administered either normal saline or aliskiren by miniosmotic pump for 8 wk.
Protocol F.
To determine the long term effect of aliskiren on the progression of HIVAN, Vpr mice in groups of five (aged 6 wk) were given either normal saline (control), Doxy, or Doxy + aliskiren for 12 wk. Aliskiren was administered by miniosmotic pumps.
Protocol G.
Tg26 was the first mouse model found to develop renal lesions identical to HIVAN (20). In addition, it has been the most frequently used mouse model to study the molecular mechanism involved in HIVAN (20, 24). Therefore, we asked whether renin inhibition would also inhibit the progression of renal lesions in Tg26 mice. It is well known that aliskiren is also an antihypertensive agent, we also explored if there was a concomitant effect of the lowering of blood pressure on the progression of renal lesions in Tg26 mice. Control mice and Tg26 mice (4 wk old) were administered either normal saline, aliskiren (50 mg·kg−1·day−1) through miniosmotic pumps, or hydralazine (250 mg/l) in drinking water.
At the end of the scheduled periods (protocols A, B, C, D, E, F, and G), the animals were anesthetized (by inhalation of isoflurane and oxygen) and killed (by a massive intraperitoneal dose of pentobarbital sodium). After euthanization, blood was collected by a cardiac puncture. Both kidneys were excised; one was processed for histological and immunohistochemical studies while the other was used for RNA and protein extraction. Three-micrometer sections were prepared and stained with hematoxylin-eosin and periodic acid Schiff stain.
Renal disease biomarkers.
Five primary phenotypes related to renal disease were characterized: blood pressure, renal histology, proteinuria (urinary protein-to-creatinine ratio), and biochemical parameters (blood urea and serum albumin) Blood pressure (systolic) was measured by CODA system (Kent Scientific CT) at a 1-wk interval. Proteinuria was measured by estimating urinary albumin: creatinine ratio by a kit supplied by Exocell (Philadelphia, PA).
Renal histology.
Renal cortical sections were stained with hematoxylin-eosin and periodic acid Schiff stain. Renal histology was scored for both tubular and glomerular injury. Renal cortical sections were coded and examined under light microscopy. Twenty random fields (×20)/mouse were examined to score percentage of the involved glomeruli and tubules. Glomerular lesions were classified as focal segmental glomerulosclerosis, global glomerulosclerosis, and collapsing glomerulosclerosis. A semiquantitative scale; 0 = no disease, 1 = 1–25% of tissue showing abnormalities, 2 = 26–50% and 3 = >50% of tissue affected were used for scoring the mesangial expansion. Two investigators, unaware of the experimental conditions scored the severity of renal lesions,.
RT-PCR Analysis
Control and experimental renal tissues were extracted to quantify mRNA expression of renin. RNA was isolated and purified using TRIZOL (Invitrogen). For cDNA synthesis, 2 μg of the total RNA were preincubated with 2 nmol of random hexamer (Invitrogen) at 65°C for 5 min. Subsequently, 8 ul of the RT reaction mixture containing Cloned AMV RT, 0.5 mM each of the mixed nucleotides, 0.10 mM dithiothreitol, and 1,000 U/ml Rnasin (Invitrogen) were incubated at 42°C for 50 min. For a negative control, a reaction mixture without RNA or RT was used. Samples were subsequently incubated at 85°C for 5 min to inactivate the RT.
Quantitative PCR was carried out in an ABI Prism 7900HT sequence detection system using the primer sequences as shown follows: renin, forward, AGGCCTTCCTTGACCAATCT; and reverse, GTGAATCCCACAAGCAAGGT. SYBR green was used as the detector and ROX as a stabilizing dye. Results (means ± SD) represent three animals as described in results. The data were analyzed using the Comparative CT method (ΔΔCT method). Differences in CT were used to quantify relative amount of PCR target contained within each well. The data were expressed as relative mRNA expression in reference to control, normalized to quantity RNA input by measurements being performed on an endogenous reference gene, GAPDH.
Protein Extraction and Western Blotting
Renal cortical tissues were treated with lysis buffer (1× PBS pH 7.4, 0.1% SDS, 1% NP-40, 0.5% sodium deoxycholate, 1 mM sodium orthovanadate, and 0 μl of protease inhibitor cocktail; 100×; Calbiochem and 100 μg/ml PMSF), homogenized with a dounce homogenizer, and then lysed on ice for 30 min. The samples were subjected to centrifugation at 15,000 g for 20 min at 4°C. The collected supernatant was assayed or protein concentration as measured by (Bio-Rad Bradford Assay). The proteins, 20–40 μg/lane, were separated on 10% SDS-PAGE and transferred onto a nitrocellulose membrane using a Bio-Rad Western blotting apparatus. After transfer, blots were stained with Ponceau S (Sigma, St. Louis, MO) to check for complete protein transfer and equal loading. The blots were blocked with 5% BSA and 0.1% Tween 20 in 1× PBS for 60 min at room temperature and then incubated with the anti-renin antibody (Santa Cruz Biotechnology, Santa Cruz, CA) overnight at 4°C. A horseradish peroxidase-conjugated appropriate secondary antibody was applied for 1 h at room temperature. The blots were then developed using a chemiluminescence detection kit (ECL; Amersham, Arlington Heights, IL) and exposed to Kodak X-OMAT AR film. Quantitative densitometry was performed on the identified band using a computer-based measurement system.
ANG II ELISA
ANG II levels were determined in the renal tissue and plasma samples from protocol C using commercial ELISA kits (Peninsula Laboratories, Belmont, CA) as described by the manufacturer. Briefly, ANG II was extracted with 20 mM Tris buffer, pH 7.4 and partially purified and concentrated after filtering through Centricon Filters (molecular weight cutoff of 10,000; Millipore, Billerica, MA).
ANG I ELISA
Since serum ANG I is the direct outcome of plasma renin activity and has been correlated well with plasma renin activity (3, 11, 14, 35), we have measured serum ANG I levels to determine the plasma renin activity. Immunoreactive ANG I levels were measured by ELISA in all protocols (Enzo Life Sciences, Farmingdale, NY).
Statistical Analysis
For comparison of mean values between two groups, the unpaired t-test was used. To compare values between multiple groups, ANOVA was used to calculate a P value. Bonferroni multiple range test was used to compare intergroup differences. Statistical significance was defined as P < 0.05. All results are expressed as means ± SD.
RESULTS
D-VprA Mice Displayed Both Glomerular and Tubular Cell Injury
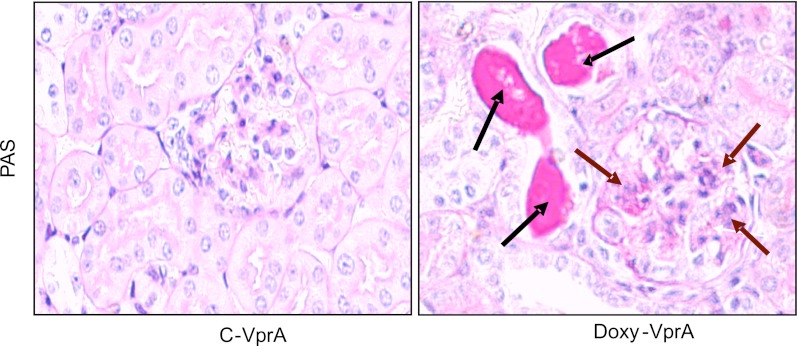
All D-VprA mice showed variable degree of focal segmental glomerular sclerosis and tubular dilatation, whereas C-VprA mice showed no glomerular or tubular abnormalities. Representative microphotographs are shown in Fig. 1.
Fig. 1.
Vpr mice display both glomerular and tubular cell injury. Representative microphotographs of renal cortical sections of control mice (C-VprA) and mice fed doxycycline (Doxy) for 6 wk (D-VprA). D-VprA mice display sclerosed glomerulus (brown arrows) and dilated tubule (black arrows). PAS, periodic acid-Schiff. Magnification = ×200.
Renin Inhibits Induction of Renal Lesions and Modulates Biomarkers in Vpr Mice during Short-Term Therapy
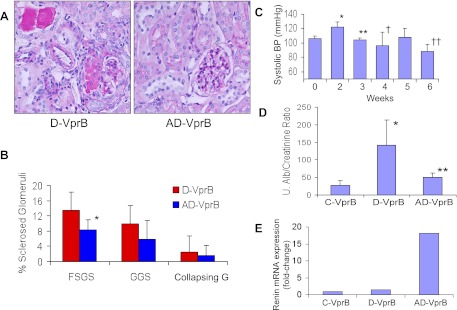
Vpr mice receiving both aliskiren and Doxy for short term (AD-VprB, 6 wk) displayed less advanced renal lesions compared with Doxy (alone)-receiving mice (D-VprB). Representative microphotographs of renal cortical sections of mice from D-VprB and AD-VprB groups are shown in Fig. 2A. Cumulative data in the form of bar graphs are shown in Fig. 2B. AD-VprB displayed a diminished (P < 0.05) number of sclerosed glomeruli when compared with D-VprB.
Fig. 2.
Aliskiren attenuates renal injury in Vpr mice during short-term therapy. Vpr mice were administered either normal saline (C-VprB) or fed Doxy in drinking water (D-VprB) or fed Doxy in drinking water and infused aliskiren via a miniosmotic pump (AD-VpB) for 6 wk. A: representative microphotographs of renal cortical sections of D-VprB and AD-VprB mice. Magnification = ×200. B: cumulative data showing percentage of sclerosed glomeruli (FSGS, focal segmental glomerulosclerosis; GGS, global glomerulosclrosis; CGS, collapsing glomerulosclerosis) in the form of bar graphs. *P < 0.05, compared with respective D-VprB. C: mean systolic blood pressure (BP) of mice receiving aliskiren (AD-VprB) before the start and at the end of the therapy. *P < 0.01 vs. at 0 wk; **P < 0.01 vs. at 2 wk; †P < 0.05 vs. at 2 wk; ††P < 0.005 vs. at 2 wk. D: urine (u) protein-to-creatinine ratio (mg/gm creatinine) at the end of the experimental period. *P < 0.01, compared with C-VprB; **P < 0.05, compared with D-VprB. E: total RNA was extracted from renal cortical tissues of C-VprB, D-VprB, and AD- VprB mice (n = 3). Quantitative mRNA expression of renin was assayed by real-time PCR.
During the second week, AD-VprB mice showed higher mean systolic blood pressure (Fig. 2C). However, as time progressed, AD-VprB mice showed diminished blood pressure (Fig. 2C). Since aliskiren inhibits renin activity, reduction of blood pressure in AD-VprB was expected.
D-VprB mice showed enhanced (P < 0.01) urinary protein-to-creatinine ratio compared with C-VprB mice. On the other hand, aliskiren-receiving mice (AD-VprB) displayed diminished (P < 0.05) proteinuria compared with D-VprB mice (Fig. 2D). There was no difference in blood urea levels among three groups.
Since aliskiren inhibits renin activity, we hypothesized that kidney tissue will display high renin expression as a negative feedback phenomenon. To determine tissue renin expression, total RNA was extracted from renal cortical tissues of C-VprB, D-VprB, and AD-VprB mice. Quantitative mRNA expression of renin was assayed by real-time PCR. Renal tissues of AD-VprB mice showed enhanced (P < 0.01) mRNA expression of renin compared with D-VprB mice (Fig. 2E).
Long-Term Effect of Renin Inhibition on Renal Lesions and Biomakers
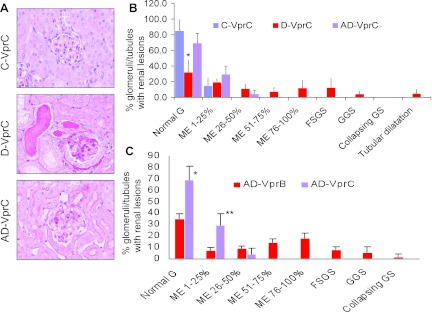
To determine the long-term effect of renin inhibition on the progression of renal lesions, Doxy-receiving Vpr mice were administered aliskiren for 12 wk. Representative microphotographs from renal cortical sections of C-VprC, D-VprC, and AD-VprC are shown in Fig. 3A. Cumulative data of renal histology displaying severity of mesangial expansion and glomerular lesions are shown in Fig. 3B. D-VprC displayed diminished percentage (P < 0.01) of normal glomeruli compared with C-VprC and AD-VprC. Renin inhibition prevented the development of severe mesangial expansion (>50%) and development of glomerular sclerosis and microcyst formation. No group other than D-VprC displayed any glomerulosclerotic lesions or microcyst formation. (Fig, 3B).
Fig. 3.
Long-term effect of renin inhibition on renal lesions. Vpr mice were administered either normal saline (C-VprC) or fed Doxy in drinking water (D-VpC) or fed Doxy in drinking water and infused aliskiren via a miniosmotic pump (AD-VprC) for 12 wk. A: representative microphotographs from renal cortical sections of C-VprC, D-VprC, and AD-VprC mice. B: cumulative data of renal histology displaying severity of mesangial expansion and glomerular lesions. D-VprC displayed diminished (*P < 0.01) percentage of normal glomeruli compared with C-VprC and AD-VprC. C: comparison of the effect of the short-term and long-term aliskiren therapy on renal lesion (AD-VprB vs. AD-VprC). *P < 0.01, compared with AD-VprB; **P < 0.01, compared with AD-VprB.
Comparison between the effect of the short-term (AD-VprB) and long-term (AD-VprC) effect of aliskiren therapy is shown in Fig. 3C. AD-VprC did not display any glomerular sclerotic lesions.
Vpr mice receiving Doxy for 12 wk displayed twofold increase in blood urea compared with control animals (C-VprC, 43.6 ± 7 mg/dl vs. D-VprC, 82.7 ± 6 mg/dl; P < 0.01). On the other hand aliskiren inhibited rise of blood urea in Doxy-receiving Vpr mice (D-VprC, 82.7 ± 6 mg/dl vs. AD-VprC, 65 .0 ± 1 mg/dl; P < 0.05).
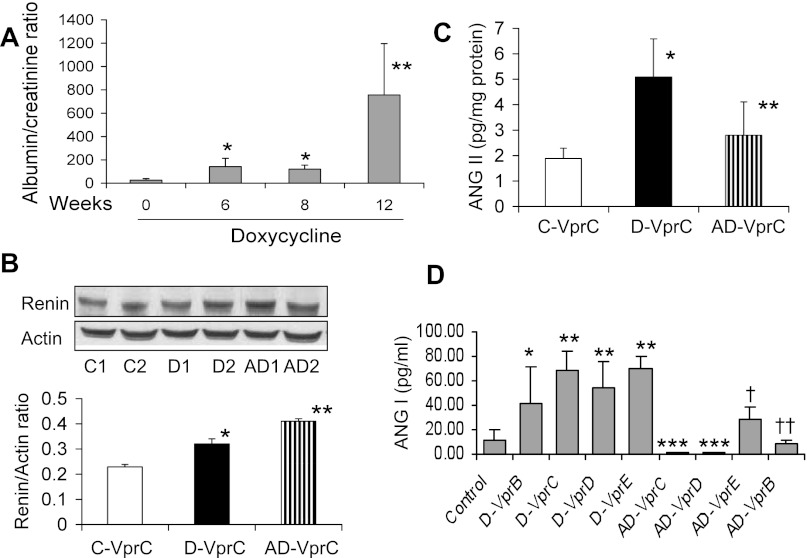
D-VprC mice displayed progressive increase in proteinuria (Fig. 4A). To determine whether enhanced renal tissue renin expression persists in aliskiren mice, immunoblots were prepared from renal tissues of C-VprC, D-VprC, and AD-VprC mice and probed for renin and actin. As shown in Fig, 4B, renal tissues from D-VprC mice exhibited enhanced renin expression (P < 0.05) compared with C-VprC mice. However, the treatment of D-Vpr mice with aliskiren (AD-VprC) further enhanced (P < 0.05) renal tissue expression.
Fig. 4.
Long-term effect of renin inhibition of biomarkers. A: urine protein excretion in D-VprC mice. Urine albumin-to-creatinine ratio was measured at 0, 6, 8, and 12 wk. D-VprC mice displayed progressive increase in proteinuria. *P < 0.05 compared at 0 time; **P < 0.01 compared with 0, 6, and 8 wk. B: tissue renin expression in C-VprC, D-VprC, and AD-VprC. Proteins were extracted from renal tissues of C-VprC, D-VprC, and AD-VprC mice, electrophoresed, and probed for renin and actin. Representative gels of C-Vpr (C1 and C2), D-VprC (D1 and D2), and AD-VprC (AD1 and AD2). Cumulative data of 4 sets of experiment are shown in the form of a bar diagram. *P < 0.05 vs. C-VprC; **P < 0.05 vs. D-VprC. C: renal tissue ANG II content in C-VprC, D-VprC, and AD-VprC. *P < 0.01 vs. C-VprC; **P < 0.05 vs. D-VprC. D: serum levels of ANG I were measured by ELISA. *P < 0.05, compared with control; **P < 0.01, compared with control; ***P < 0.01, compared respective Doxy-treated mice; †P < 0.01, compared with D-VprE; ††P <0.05, compared with D-VprB.
Since aliskiren mice exhibited diminished blood pressure (D-VprC, 122 ± 7 vs. AD-VprC, 91 ± 8 mmHg; P < 0.01), we hypothesized that because of the inhibition of renin activity, renal tissues of aliskiren mice are likely to show attenuated ANG II production. To determine renal tissue ANG II content, protein lysates of renal tissues from C-VprC, D-VprC, and AD-VprC were assayed for ANG II by ELISA. Renal tissues of D-VprC mice displayed increased (P < 0.01) amount of ANG II production compared with C-VprC mice (Fig. 4C). However, renal tissues of AD-VprC mice showed decreased (P < 0.05) amount of ANG II production compared with D-VprC mice. There was no difference in renal tissue ANG II content between C-VprC and AD-VprC mice. These findings indicate that aliskiren-mediated modulation of renal lesions and biomarkers may be an outcome of diminished renal tissue ANG II production by HIVAN mice while being treated with aliskiren.
Since aliskiren treatment reduced renal tissue ANG II concentrations but increased renin protein expression, we asked whether aliskiren was inhibiting plasma renin activity. Several investigators reported a correlation of plasma renin activity with serum ANG I levels (3, 11, 14, 35). In several studies, plasma renin activity was derived by their serum renin ANG I level. Therefore, we measured serum ANG I levels in all the protocols. Mean serum ANG I levels in control and treatment protocols are shown in Fig. 4D. In all groups, Doxy (alone)-receiving mice displayed increased serum ANG I levels, whereas all aliskiren-treated mice displayed diminished serum ANG I levels.
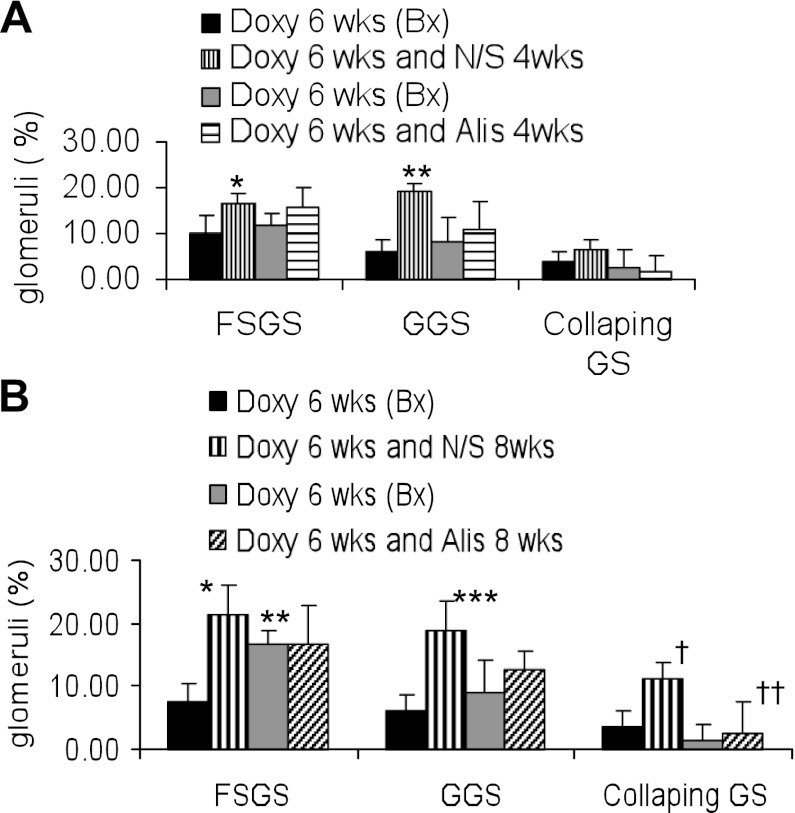
Since the development of renal lesions and its severity was not uniform in Vpr mice receiving Doxy, we carried out renal biopsy (after 6 wk of Doxy administration) to confirm the development of renal lesions. After confirmation of the development of renal lesions, Vpr mice were given either normal saline or aiskliren for either 4 wk (protocol D) or 8 wk (protocal E). Renal histology of the biopsy specimens of the protocol D are shown in Fig. 5A and of the protocol E, are shown in Fig. 5B. Renal lesions in both D-VprD and AD-VprD group were comparable at 6 wk (Fig. 5A); however, AD-VprE mice displayed enhanced (P < 0.05) percentage of sclerosed glomeruli compared with D-VprE at 6 wk (Fig. 5B). These findings indicated the importance of carrying out biopsies in these mice before starting aliskiren therapy. Aliskiren treatment slowed down the progression of glomerulosclerosis both in short-term (Fig. 5A) and long-term ( Fig. 5B) treatment.
Fig. 5.
Effect of renin inhibition on the progression of renal lesions. A: mice underwent kidney biopsy (Bx) after receiving Doxy for 6 wk (D-VprD, Pre-N/S). Mice with renal lesions were administered normal saline (D-VprD) or aliskiren (AD-VprD) for 4 wk (protocol D). Bonferroni multiple comparison test was used. *P < 0.01 vs. respective Doxy. **P < 0.01 vs. respective Doxy. B: mice underwent kidney biopsy after receiving Doxy for 6 wk (D-VprE, Pre-N/S). Mice with renal lesion were administered normal saline (D-VprE) or aliskiren (AD-VprE) for 8 wk (protocol E). Bonferroni multiple comparison test was used. *P < 0.001 vs. respective Doxy. **P < 0.05 vs. Pre-N/S. Doxy. *** P < 0.001 vs. respective Doxy. †P < 0.01 vs. respective Doxy. ††P < 0.01 vs. Doxy + N/S.
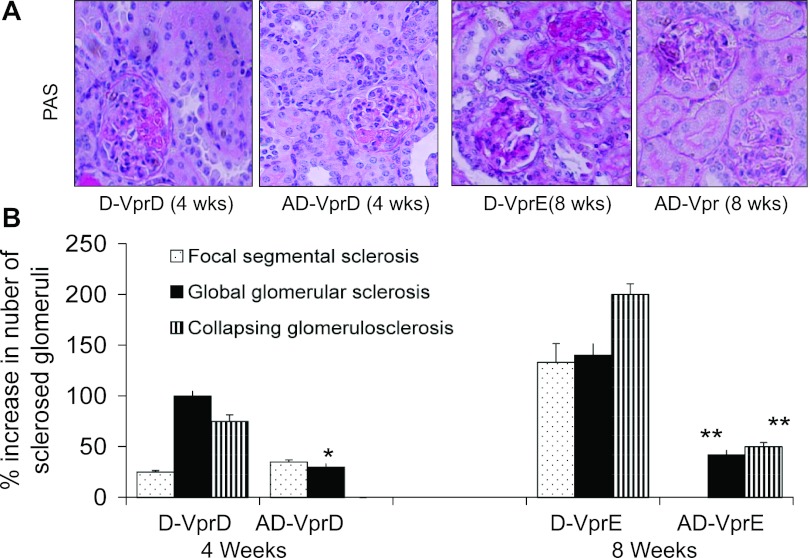
Representative renal cortical microphotographs displaying glomerular lesions in mice from the protocols D and E are shown in Fig. 6A. Cumulative data on the progression of glomerular lesions in mice from the protocols D and E are shown in Fig. 6B. The aliskiren-treated group displayed a slower progression of global sclerosis and absence of the progression of collapsing glomerulosclerosis in the protocol D. Interestingly, the aliskiren-treated group displayed a markedly decreased progression of both global and collapsing glomerulosclerosis and absence of the progression of focal glomerulosclerosis in the protocol E.
Fig. 6.
Effect of renin inhibition on the progression of glomerular lesions Mice underwent kidney biopsy after receiving Doxy for 6 wk. Mice with renal lesion were administered either normal saline or aliskiren for either 4 wk (protocol D) or 8 wk (protocol E). A: representative microphotographs of renal cortical sections from the protocols D (4 wk) and E (8 wk). B: cumulative data showing percentage increase in sclerosed glomeruli in protocols D and E. *P < 0.01, compared with respective GGS; **P < 0.01, compared with respective GGS and CGS.
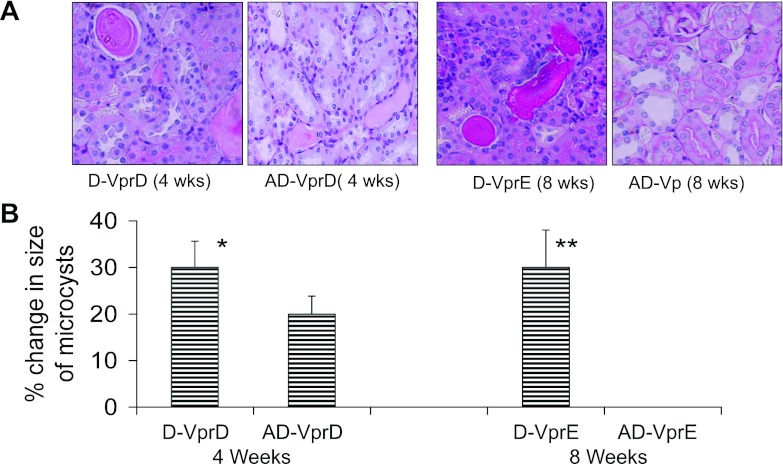
Representative renal cortical microphotographs displaying tubular lesions in mice from the protocols D and E are shown in Fig. 7A. Cumulative data on the increase in the size of the microcysts from the protocols D and E are shown in Fig. 7B. The aliskiren-treated group displayed a slower increase in the size of microcysts in the protocol D. Interestingly, the aliskiren-treated group displayed no increase in the size of the microcysts in the protocol E.
Fig. 7.
Effect of renin inhibition on the progression of tubular lesions. Mice underwent kidney biopsy after receiving Doxy for 6 wk. Mice with renal lesion were administered either normal saline or aliskiren for either 4 wk (protocol D) or 8 wk (protocol E). A: representative microphotographs of renal cortical sections from the protocols D (4 wk) and E (8 wk) are shown. B: cumulative data showing percentage change in the size of microcysts in protocols D and E. *P < 0.01, compared with respective AD-VprD; **P < 0.001, compared with respective AD-VprE.
Renin Inhibition Also Slows Down the Progression of Renal Lesions and Modulates Biomarkers in Tg26 Mice
A Tg26 mouse is the most commonly used mouse model to study the mechanism involved in the development and the progression of HIVAN (20, 24). These animals develop more severe renal lesions compared with Vpr mice. We asked whether renin activity inhibition could also modulate HIVAN in these mice. Since protenuria and renal lesions can also be modulated through a reduction in blood pressure, we asked whether the reduction of blood pressure alone would modulate proteinuria and renal lesions in HIVAN mice. To decrease blood pressure in Tg26 mice, they were given hydralazine in drinking water.
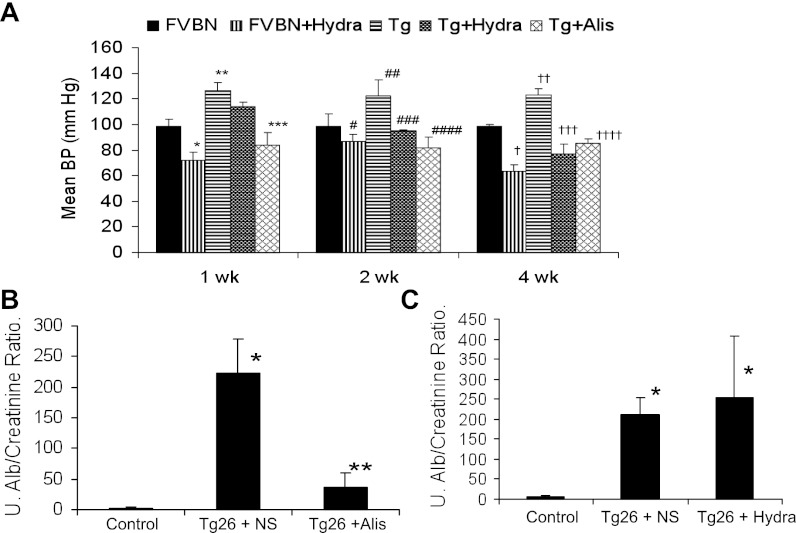
Hydralazine-receiving FVBN, hydralazine-receiving Tg26, and aliskiren-receiving Tg26 mice displayed decrease in their mean systolic blood pressure compared with saline-receiving FVBN and Tg26 mice (Fig. 8A). Aliskiren-receiving Tg26 mice displayed diminished urinary protein-to-creatinine ratio compared with saline-receiving mice (Fig. 8B). However, hydralazine-receiving Tg26 mice did not show any alteration in the severity of proteinuria compared with saline-receiving Tg 26 mice (Fig. 8C).
Fig. 8.
Renin inhibition modulates biomarkers in Tg26 mice. A: aliskiren and hydralazine decrease blood pressure in Tg26 mice. Control and Tg26 were administered normal saline, aliskiren, or hydralazine for 4 wk. Blood pressure was recorded at the end of 1, 2, and 4 wk. *P < 0.001 vs. FVBN, week 1; **P < 0.001 vs. FVBN week 1. ***P < 0.001 vs. Tg, week 1. #P < 0.05 vs. FVBN, week 2; ##P < 0.001 vs. FVBN, week 2; ###P < 0.001 vs. Tg, week 2; ####P < 0.001 vs. Tg, week 2. †P < 0.001 vs. FVBN, week 4; ††P < 0.001 vs. FVBN, week 4; †††P < 0.001 vs. Tg, week 4; ††††P < 0.001 vs. Tg, week 4. B: urinary albumin-to-creatinine ratio in control receiving normal saline, Tg26 receiving normal saline (Tg + NS), and Tg 26 mice receiving aliskiren (Tg + Alis) at the end of 4 wk. *P < 0.001, compared with control; **P < 0.01, compared with Tg + NS. Urinary (U) albumin-to-creatinine ratio in control mice receiving normal saline, Tg26 receiving normal saline (Tg +S), and Tg 26 mice receiving hydralazine (Tg + hydra) at the end of 4 wk. *P < 0.01, compared with control.
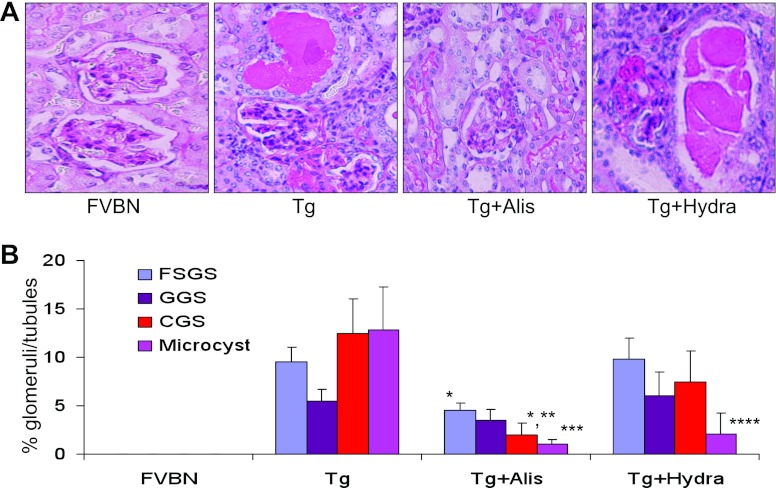
Representative microphotographs of cortical sections of control (FVBN), Tg26 (Tg), aliskiren-receiving Tg26 mice, and hydralazine-receiving Tg26 mice are shown in Fig. 9A. Cumulative data showing percentages of sclerosed glomeruli and microcysts are shown in Fig. 9B. Aliskiren-receiving Tg26 mice displayed attenuated (P < 0.01) development of focal segmental glomerulosclerosis when compared with normal saline-receiving Tg26 mice. Similarly, aliskiren-receiving mice displayed diminished (P < 0.001) collapsing glomerulosclerosis compared with saline-receiving Tg26 mice. Aliskiren-receiving animals also exhibited fewer percentages (P < 0.001) of microcysts compared with saline-receiving Tg26 mice. Hydralazine-receiving Tg26 mice showed diminution (P < 0.01) in microcysts formation compared with saline-receiving Tg26 mice. The percentage of microcysts formation was comparable between aliskiren-receiving Tg26 mice and hydralazine-receiving Tg26 animals. Hydralazine-receiving mice displayed decrease in the number of sclerosed glomeruli compared with saline-receiving mice, but it was not statistically significant. However, our data suggest that lowering of blood pressure due to inhibition of renin activity might have contributed only partly to slowing of renal lesions in aliskiren-receiving mice.
Fig. 9.
Renin inhibition slows down the progression of renal lesions in Tg26 mice. Control and Tg26 mice were administered normal saline, aliskiren, or hydralazine for 4 wk. A: representative microphotographs of cortical sections of control (FVBN), Tg26 (Tg), aliskiren-receiving Tg26 mouse, and hydralazine-receiving Tg26 mouse. B: cumulative data showing percentage sclerosed glomeruli and microcyst formation. *P < 0.01, compared with respective FSGS in Tg. **P < 0.001, compared with respective CGS in Tg. ***P < 0.01, compared with respective microcysts in Tg. ****P < 0.01, compared with microcysts in Tg.
DISCUSSION
In the present study, aliskiren attenuated both glomerular and tubular lesions in short-term as well as long-term experimental studies. In addition, renin activity blockade inhibited proteinuria in Vpr mice. Vpr mice displayed activated RAS in the form of enhanced renal tissue renin expression and increased ANG II content. Use of aliskiren not only inhibited activity of renin in the form of diminished serum ANG I levels but also attenuated renal tissue ANG II content in Vpr mice. Since aliskiren also attenuated the progression of renal lesions in Tg26 mice, it suggests that the effect of renin inhibition on the progression of renal lesions is not limited to Vpr model only. Interestingly, hydralazine also attenuated microcyst formation in Tg26 mice. Thus it is possible that aliskiren could be modulating the progression of renal lesions in Tg26 mice partly by decreasing their blood pressure.
The circulating RAS acts like an endocrine system that regulates blood pressure and maintains fluid and electrolyte homeostasis (31). The RAS also functions in a paracrine manner locally at tissue levels to regulate pathological events associated with organ dysfunction (28). The renal cells not only contain all the components of the RAS but have also been demonstrated to form intra-renal ANG II (21). In the present study, Vpr mice showed development of renal lesions in association with the RAS activation. On the other hand, the modulation of the RAS by inhibiting renin activity was associated with the attenuation of renal lesions. Thus there appears to be a causal relationship between attenuation of renal lesions and inhibition or renin activity in Vpr mice. Moreover, our data indicate that enhanced renal tissue renin expression in aliskiren-treated Vpr mice was a consequence of the inhibition of renin activity (a negative feedback phenomenon). Other investigators (8) also suggested that inhibition of renin activity could contribute to the enhanced generation of pro-renin. The latter converts into renin; thus, it would seem that inhibition of kidney cell renin activity would trigger increased production of pro-renin in kidney cells. Testing this hypothesis will be our goal in future studies.
The discovery of the pro-renin receptor (8), which binds both renin and pro-renin, has provided new insight into the functioning of the RAS (8). Binding of renin to pro-renin receptor increases its catalytic activity, whereas, pro-renin, which is normally inactive, becomes catalytically active after binding to pro-renin receptor (27). In diabetics, pro-renin represents 95% of circulating renin and has been suggested to contribute to the pathogenesis of diabetic glomerulosclerosis through the activation of the RAS (16). Moreover, many of the direct effects of pro-renin seem to be independent of its action through ANG II; for example, the activation of the pro-renin receptor in mesangial cells activates ERK 1 and ERK 2, transforming growth factor-β, and plasminogen activator inhibitor-1 (16, 18, 27). These effects are independent of ANG II as they occur in the presence of ACE inhibitors or ARBs (27). Currently, to our knowledge, there are no available data on the circulating pro-renin in HIVAN patients; however, it will be worthwhile looking into this aspect in future studies.
Proteinuria and hypertension are two major determinants for the progression of any kidney disease (29, 30); interestingly, the majority of HIVAN patients do not have blood pressure elevation during the initiation of the disease (4); nonetheless, as renal failure progresses, HIVAN patients do develop elevated blood pressure. Moreover, HIVAN patients develop significant hypoproteinemia as the result of massive proteinuria. Hypoproteinemia in HIVAN patients may result in decrease in blood volume and associated diminution in renal perfusion; the latter may stimulate glomerular renin production and activation of the RAS; therefore, HIVAN patients often display glomerular hypertension in the presence of normal systemic blood pressure. On that account, protienuric patients are being treated with either ANG II blockers or ACE inhibitors to downregulate glomerular hypertension and proteinuria in general and HIVAN patients in particular (4, 29, 30).
Although use of ACE inhibitors and ARBs in patients with HIVAN as well as with other chronic kidney diseases is the standard therapy but the net outcome in the terms of morbidity and mortality has not changed (33). This suboptimal outcome in patients treated with ACE inhibitors and ARBs has been suggested to be a consequence of continued activation of the RAS in the kidney tissues (13). In up to 50% of patients treated with ACE inhibitors, ANG II levels gradually returned to baseline (32) due to increased plasma renin activity, a consequence of the feedback loop disruption (1). Moreover, ANG II can be formed from ANG I by alternative pathways, such as chymase (17). Similarly, ARBs enhance plasma renin activity by disrupting the ANG II-renin release feedback loop (17). Since use of both ACE and ARBs end up resulting in enhanced plasma renin activity, inhibition of renin activity carry significant potential in providing protection against the activation of the RAS at the systemic as well as local tissue level. In the present study, serum ANG I and renal tissue ANG II levels were lower in Vpr mice after treatment with aliskiren for 12 wk. These findings indicated that inhibition of renin activity was able to attenuate the activation of the kidney tissue RAS during the prolonged therapy. In addition, the findings in the present study are consistent with the hypothesis that inhibition of renin activity carries the potential to slow down the progression of renal lesions in kidney disease models, which are modulated through the activation of the RAS.
The mechanisms by which aliskiren contributes to reno-protection are being increasingly recognized. Aliskiren may contribute in slowing down the progression of renal lesions through multiple mechanisms 1) it not only inhibits renin activity but also inhibits the activity of prorenin (12) following its nonproteolytic activation upon binding to the (pro) renin receptor (2); 2) it blocks the circulating RAS and lowers blood pressure (5); 3) it blocks the intrarenal RAS and lowers renal ANG I and ANG II levels (25); and 4) it reduces the renal expression of the (pro)-renin receptor in diseases such as diabetes (12). In the present study, we have focused only on two of its mechanisms, i.e., the inhibitory effect on renal tissue ANG II production and lowering of systemic blood pressure. We have not investigated other effects of aliskiren in HIVAN; however, it would be important to evaluate other effects of aliskiren in HIVAN in future studies.
In the present study, aliskiren was started in Vpr mice after the development of glomerular lesions (protocols D and E) as well as before the development of renal lesions (protocols B and C). In the protocols B and C, use of aliskiren slowed the progression of renal lesions in Vpr mice when compared with Vpr mice-receiving vehicle only. These studies indicated that the activation of the RAS was contributing to the progression of renal lesions in Vpr mice; on that account, the inhibition of renin activity slowed the progression of renal lesions in Vpr mice. Interestingly, Vpr mice, which were started with aliskiren at the initiation of Doxy (to induce Vpr gene expression) in short-term studies (protocol B), developed diminished number of focal sclerotic glomerular lesions but did not display any differences in percentage of collapsing glomeruli. On the other hand, Vpr mice treated with aliskiren for the long-term (protocol C) did not develop any sclerotic or collapsing glomerular lesions. These findings suggest that inhibition of renin activity for long term in HIVAN has a potential for the resolution of renal lesions. However, the latter part needs to be further confirmed in future studies.
In conclusion, we have demonstrated that inhibition of renin activity slows down the progression of renal lesions in HIVAN. The present study has highlighted the role of RAS in the development and progression of HIVAN.
GRANTS
This work was supported by grants from Novartis Pharmaceuticals (East Hanover, NJ) and National Institute of Diabetes and Digestive and Kidney Diseases Grant RO1-DK-084910 (to P. C. Singhal).
DISCLOSURES
No conflicts of interest, financial or otherwise, are declared by the author(s).
AUTHOR CONTRIBUTIONS
Author contributions: D.K., P.R., R.L., and N.C. performed experiments; D.K., S.S., A.S., M.A., and P.C.S. prepared figures; D.K., A.P., I.Y., D.D.T., S.S., A.S., P.R., M.A., R.L., G.D., A.M., and P.C.S. approved final version of manuscript; A.P., I.Y., and D.D.T. analyzed data; G.D., A.M., and P.C.S. interpreted results of experiments; P.C.S. conception and design of research; P.C.S. drafted manuscript.
ACKNOWLEDGMENTS
This work was presented at the 43rd Annual Meeting of the American Society of Nephrology (2011) held in Philadelphia, PA.
REFERENCES
- 1.Atlas SA. The renin-angiotensin aldosterone system: pathophysiological role and pharmacologic inhibition. J Manag Care Pharm 13: 9–20, 2007 [DOI] [PMC free article] [PubMed] [Google Scholar]
- 2.Azizi M, Menard J. Combined blockade of the renin-angiotensin system with angiotensin-converting enzyme inhibitors and angiotensin II type 1 receptor antagonists. Circulation 109: 2492–2499, 2004 [DOI] [PubMed] [Google Scholar]
- 3.Brown JJ, Lever AF, Davies DL, Robertson JI. Renin and angiotensin. A survey of some aspects. Postgrad Med J 42: 153–176, 1966 [DOI] [PMC free article] [PubMed] [Google Scholar]
- 4.Bruggeman LA, Nelson PJ. Controversies in the pathogenesis of HIV-associated renal diseases. Nat Rev Nephrol 5: 574–581, 2009 [DOI] [PMC free article] [PubMed] [Google Scholar]
- 5.Burgess E, Muirhead N, Rene de Cotret P, Chiu A, Pichette V, Tobe S; SMART (Supra Maximal Atacand Renal Trial) Investigators. Supramaximal dose of candesartan in proteinuric renal disease. J Am Soc Nephrol 20: 893–900, 2009 [DOI] [PMC free article] [PubMed] [Google Scholar]
- 6.Burns GC, Paul SK, Toth IR, Sivak SL. Effect of angiotensin-converting enzyme inhibition in HIV-associated nephropathy. J Am Soc Nephrol 8: 1140–1146, 1997 [DOI] [PubMed] [Google Scholar]
- 7.Campbell RC, Ruggeneti P, Remuzzi G. Halting the progression of chronic nephropathy. J Am Soc Nephrol 13: 190–195, 2002 [DOI] [PubMed] [Google Scholar]
- 8.Danser AJ. The increase in renin during renin inhibition: does it result in harmful effects by the (pro)renin receptor? Hypertens Res 33: 4–10, 2010 [DOI] [PubMed] [Google Scholar]
- 9.Dickie P, Roberts A, Uwiera R, Witmer J, Sharma K, Kopp JB. Focal glomerulosclerosis in proviral and c-fms transgenic mice links Vpr expression to HIV-associated nephropathy. Virology 322: 69–81, 2004 [DOI] [PubMed] [Google Scholar]
- 10.Ellmers LJ, Scott NJ, Medicherla S, Pilbrow AP, Bridgman PG, Yandle TG, Richards AM, Protter AA, Cameron VA. Transforming growth factor-beta blockade down-regulates the renin-angiotensin system and modifies cardiac remodeling after myocardial infarction. Endocrinology 149: 5828–5834, 2008 [DOI] [PubMed] [Google Scholar]
- 11.Favre L, Vallotton MB, Muller AF. Relationship between plasma concentrations of angiotensin I, angiotensin II and plasma renin activity during cardio-pulmonary bypass in man. Eur J Clin Invest 4: 135–140, 1974 [DOI] [PubMed] [Google Scholar]
- 12.Fried LF, Duckworth W, Zhang JH, O'Connor T, Brophy M, Emanuele N, Huang GD, McCullough PA, Palevsky PM, Seliger S, Warren SR, Peduzzi P; VA NEPHRON-D Investigators. Design of combination angiotensin receptor blocker and angiotensin-converting enzyme inhibitor for treatment of diabetic nephropathy (VA NEPHRON-D). Clin J Am Soc Nephrol 4: 361–368, 2009 [DOI] [PMC free article] [PubMed] [Google Scholar]
- 13.Giacchetti G, Sechi LA, Rilli S, Carey RM. The renin-angiotensin-aldosterone system, glucose metabolism and diabetes. Trends Endocrinol Metab 16: 120–126, 2005 [DOI] [PubMed] [Google Scholar]
- 14.Haefliger JA, Krattinger N, Martin D, Pedrazzini T, Capponi A, Döring B, Plum A, Charollais A, Willecke K, Meda P. Connexin43-dependent mechanism modulates renin secretion and hypertension. J Clin Invest 116: 405–413 2006 [DOI] [PMC free article] [PubMed] [Google Scholar]
- 15.Hiramatsu N, Hiromura K, Shigehara T, Kuroiwa T, Ideura H, Sakurai N, Takeuchi S, Tomioka M, Ikeuchi H, Kaneko Y, Ueki K, Kopp JB, Nojima Y. Angiotensin II type 1 receptor blockade inhibits the development and progression. J Am Soc Nephrol 18: 515–27, 2007 [DOI] [PubMed] [Google Scholar]
- 16.Hollenberg NK. Direct renin inhibition and the kidney. Nat Rev Nephrol 6: 49–55, 2010 [DOI] [PubMed] [Google Scholar]
- 17.Huang XR, Chen WY, Truong LD, Lan HY. Chymase is upregulated in diabetic nephropathy: implications for an alternative pathway of angiotensin II-mediated diabetic renal and vascular disease. J Am Soc Nephrol 14: 1738–1747, 2003 [DOI] [PubMed] [Google Scholar]
- 18.Huang Y, Wongamorntham S, Kasting J, McQuillan D, Owens RT, Yu L, Noble NA, Border W. Renin increases mesangial cell transforming growth factor-beta1 and matrix proteins through receptor-mediated, angiotensin II-independent mechanisms. Kidney Int 69: 105–113, 2006 [DOI] [PubMed] [Google Scholar]
- 19.Ideura H, Hiromura K, Hiramatsu N, Shigehara T, Takeuchi S, Tomioka M, Sakairi T, Yamashita S, Maeshima A, Kaneko Y, Kuroiwa T, Kopp JB, Nojima Y. Angiotensin II provokes podocyte injury in murine model of HIV-associated nephropathy. Am J Physiol Renal Physiol 293: F1214–F1221, 2007 [DOI] [PubMed] [Google Scholar]
- 20.Klotman PE, Rappaport J, Ray P, Kopp JB, Franks R, Bruggeman LA, Notkins AL. Transgenic models of HIV-1. AIDS 9: 313–324, 1995 [PubMed] [Google Scholar]
- 21.Kobori H, Nangaku M, Navar LG, Nishiyama A. The intrarenal renin-angiotensin system: from physiology to the pathobiology of hypertension and kidney disease. Pharmacol Rev 59: 251–287, 2007 [DOI] [PubMed] [Google Scholar]
- 22.Kumar D, Salhan D, Magoon S, Torri DD, Sayeneni S, Sagar A, Bandhlish A, Malhotra A, Chander PN, Singhal PC. Adverse host factors exacerbate occult HIV-associated nephropathy. Am J Pathol 179: 1681–1692, 2011 [DOI] [PMC free article] [PubMed] [Google Scholar]
- 23.Li YC, Kong J, Wei M, Chen ZF, Liu SQ, Cao LP. 1, 25-Dihydroxyvitamin D(3) is a negative endocrine regulator of the renin-angiotensin system. J Clin Invest 110: 229–238, 2002 [DOI] [PMC free article] [PubMed] [Google Scholar]
- 24.Lu TC, He JC, Klotman P. Animal models of HIV-associated nephropathy. Curr Opin Nephrol Hypertens 15: 233–237, 2006 [DOI] [PubMed] [Google Scholar]
- 25.Maione A, Nicolucci A, Craig JC, Tognoni G, Moschetta A, Palasciano G, Pugliese G, Procaccini DA, Gesualdo L, Pellegrini F, Strippoli GF. Protocol of the Long-term Impact of RAS Inhibition on Cardiorenal Outcomes (LIRICO) randomized trial. J Nephrol 20: 646–655, 2007 [PubMed] [Google Scholar]
- 26.Mazzali M, Hughes J, Kim YG, Jefferson JA, Kang DH, Gordon KL, Lan HY, Kivlighn S, Johnson RJ. Elevated uric acid increases blood pressure in the rat by a novel crystal-independent mechanism. Hypertension 38: 1101–1106, 2001 [DOI] [PubMed] [Google Scholar]
- 27.Nguyen G, Delarue F, Burckle C, Bouzhir L, Giller T, Sraer JD. Pivotal role of the renin/prorenin receptor in angiotensin II production and cellular responses to renin. J Clin Invest 109: 1417–1427, 2002 [DOI] [PMC free article] [PubMed] [Google Scholar]
- 28.Paul M, Poyan Mehr A, Kreutz R. Physiology of local renin-angiotensin systems. Physiol Rev 86: 747–803, 2006 [DOI] [PubMed] [Google Scholar]
- 29.Pohl MA, Blumenthal S, Cordonnier DJ, De Alvaro F, Deferrari G, Eisner G, Esmatjes E, Gilbert RE, Hunsicker LG, de Faria JB, Mangili R, Moore J, Jr, Reisin E, Ritz E, Schernthaner G, Spitalewitz S, Tindall H, Rodby RA, Lewis EJ. Independent and additive impact of blood pressure control and angiotensin II receptor blockade on renal outcomes in the irbesartan diabetic nephropathy trial: clinical implications and limitations. J Am Soc Nephrol 16: 3027–3037, 2005 [DOI] [PubMed] [Google Scholar]
- 30.Remuzzi G, Benigni A, Remuzzi A. Mechanisms of progression, and regression of renal lesions of chronic nephropathies and diabetes. J Clin Invest 116: 288–296, 2006 [DOI] [PMC free article] [PubMed] [Google Scholar]
- 31.Ribeiro-Oliveira A, Jr, Nogueira AI, Pereira RM, Boas WW, Dos Santos RA, Simões e Silva AC. The renin-angiotensin system and diabetes: an update. Vasc Health Risk Manag 4: 787–803, 2008 [PMC free article] [PubMed] [Google Scholar]
- 32.Roig E, Perez-Villa F, Morales M, Jiménez W, Orús J, Heras M, Sanz G. Clinical implications of increased plasma angiotensin II despite ACE inhibitor therapy in patients with congestive heart failure. Eur Heart J 21: 53–57, 2000 [DOI] [PubMed] [Google Scholar]
- 33.Ruggenenti P, Bettinaglio P, Pinares F, Remuzzi G. Angiotensin converting enzyme insertion/deletion polymorphism and renoprotection in diabetic and nondiabetic nephropathies. Clin J Am Soc Nephrol 3: 1511–1525, 2008 [DOI] [PMC free article] [PubMed] [Google Scholar]
- 34.Sakurai N, Kuroiwa T, Ikeuchi H, Hiramatsu N, Takeuchi S, Tomioka M, Shigehara T, Maeshima A, Kaneko Y, Hiromura K, Kopp JB, Nojima Y. Fluvastatin prevents podocyte injury in a murine model of HIV-associated nephropathy. Nephrol Dial Transplant 24: 2378–83, 2009 [DOI] [PubMed] [Google Scholar]
- 35.Sealey JE. Plasma renin activity and plasma prorenin assays.. Clin Chem 37: 1811–1819, 1991 [PubMed] [Google Scholar]
- 36.Todorov V, Muller M, Schweda F, Kurtz A. Tumor necrosis factor-alpha inhibits renin gene expression. Am J Physiol Regul Integr Comp Physiol 283: R1046–R1051, 2002 [DOI] [PubMed] [Google Scholar]
- 37.Wolf G, Ritz E. Combination therapy with ACE inhibitors and angiotensin II receptor blockers to halt progression of chronic renal disease: pathophysiology and indications. Kidney Int 67: 799–812, 2005 [DOI] [PubMed] [Google Scholar]


