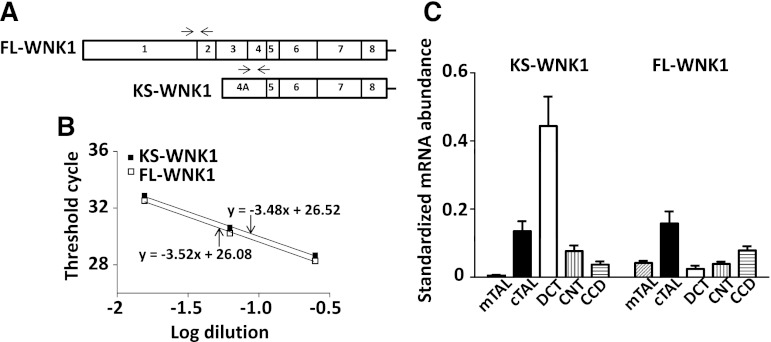
Fig. 2.
Quantitative comparison of WNK1 isoform expression in distal nephron. A: schematic representation of beginning exons of WNK1 gene showing the positions of primers (arrows) used for RT-PCR analysis of full-length WNK1 (FL-WNK1) and kidney-specific WNK1 (KS-WNK1) in this study. B: similar efficiencies of KS-WNK1 and FL-WNK1 RT-PCR assays. Wild-type cTAL cDNA was serially diluted ¼ (4-, 16-, and 64-fold dilution), and 3 μl of each dilution were used in the KS-WNK1 and FL-WNK1 PCR assays. Threshold cycle was measured and plotted against the log of the dilution. Slope of liner regression was used to calculate the efficiency of RT-PCR. C: mRNA levels of KS-WNK1 and FL-WNK1 in each individual tubular segments under the control K+ diet. WNK1 isoforms in each sample were normalized to the mRNA level of its own housekeeping GAPDH gene; n = 10 tubules for each.

