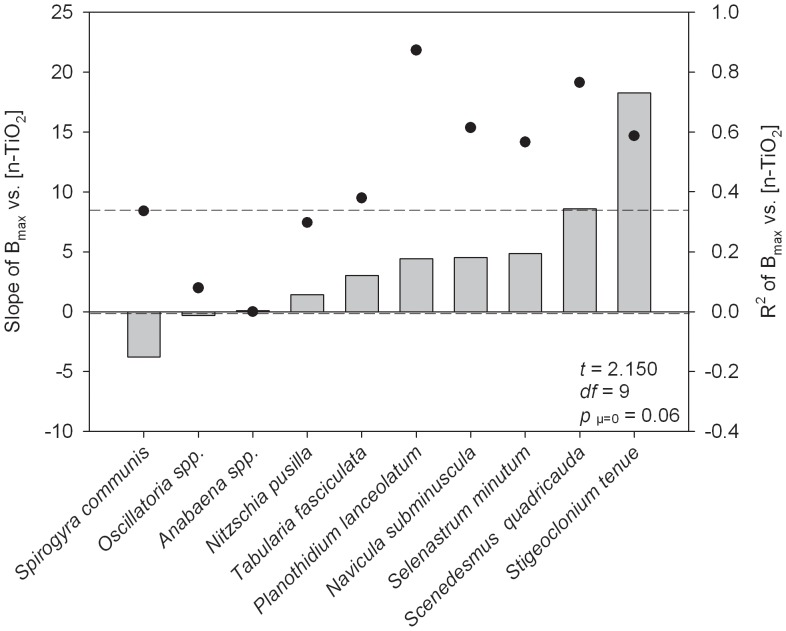
Figure 2. Effects of increasing concentrations of n-TiO2 on maximum algal biomass.
Slopes of maximum algal biomass (as measured by fluorescence; Bmax) versus exposure concentration of n-TiO2 ([n-TiO2], in mg L−1). Dots represent the R2 of the trendline represented by each bar. Statistics shown relate to a 1-sample t-test, comparing the average of the slopes to a Ho = 0. Dotted lines represent the 95% confidence intervals around the mean of all slopes. Positive (or negative) bars indicate that increasing exposure concentrations of n-TiO2 had increasingly positive (or negative) effects on Bmax.

