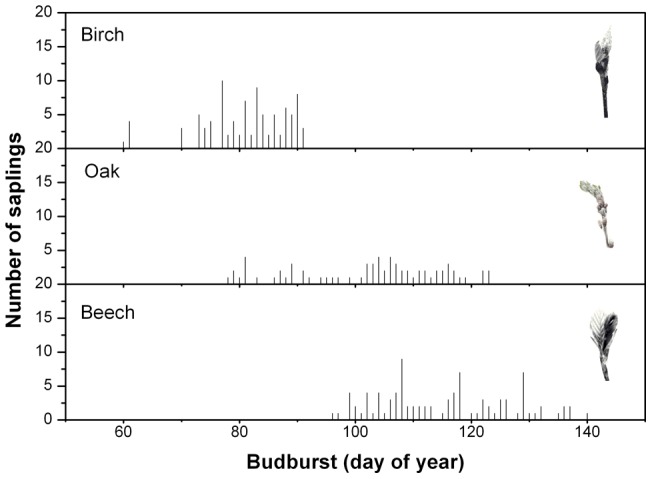
Figure 1. Frequency distribution of budburst dates of the experimental trees for the three studied species.

Frequency distribution of budburst dates of the experimental trees for the three studied species. The number of saplings for a given budburst date is presented on the Y-axis. The small photos on the upper right part of each panel visually show the stage of leaf development when we considered budburst to have occurred.
