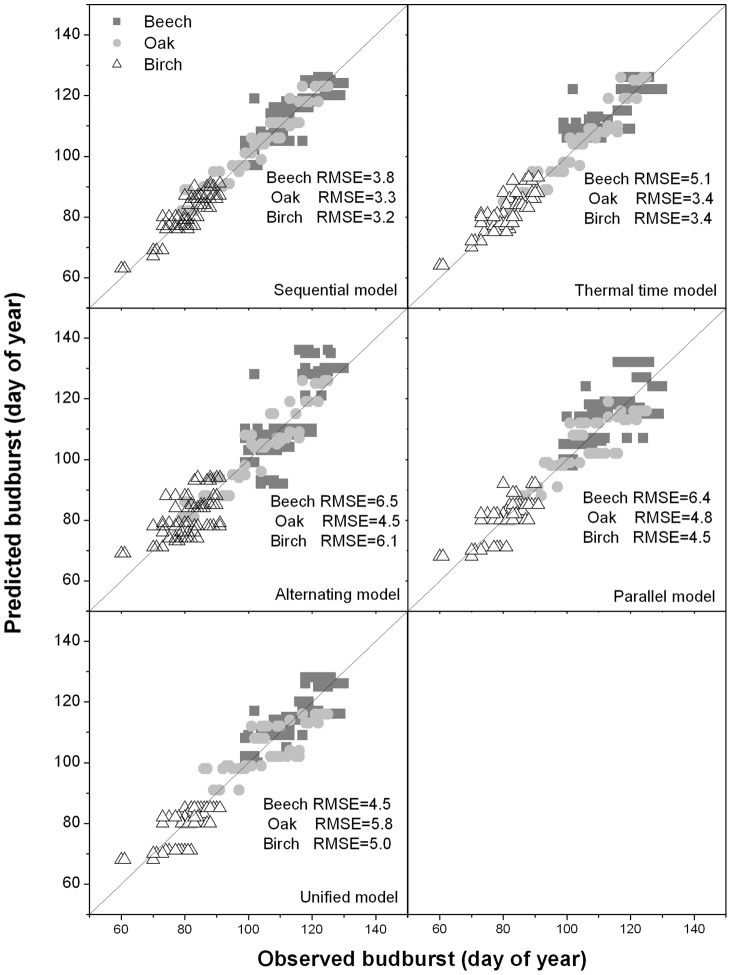
Figure 3. Comparison of the observed budburst dates with the predicted values for five models.
Comparison of the observed budburst dates with the predicted values for five models fitted on the whole observation dataset. Data are for three species. The diagonal line is the 1∶1 line, whereas RMSE is the Root Mean Square Error.

