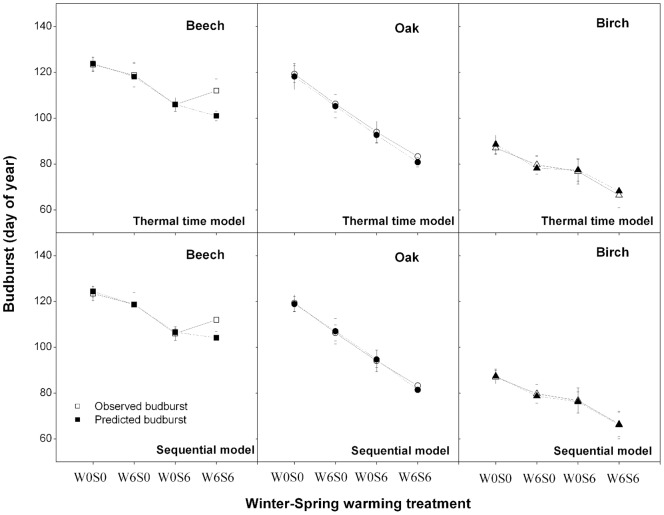
Figure 4. Modeled against observed budburst dates for different warming treatments.
Modeled against observed budburst dates for different warming treatments (W0S0: no warming; W6S6: winter and spring warming; W6S0: winter warming only, and W0S6: spring warming only; winter is from December 1 2009 to February 22 2010 and spring from February 22 to budburst date) when using the Sequential model and the Thermal time model for each species. The models were fitted on the whole observation dataset. The observed budburst dates are represented by open symbols and the predicted budburst dates are represented by solid symbols.

