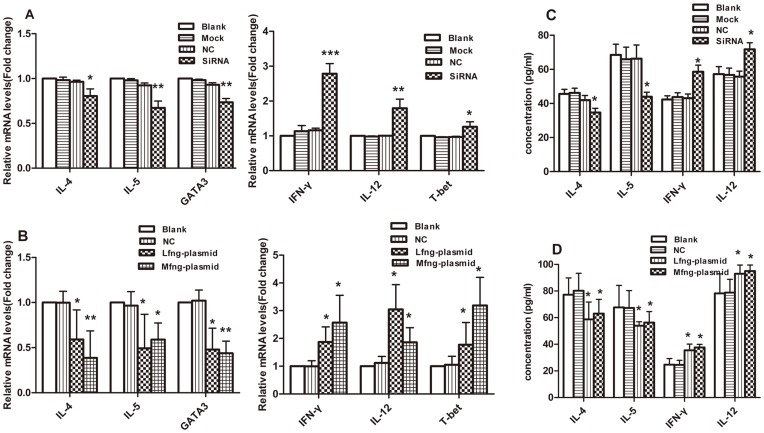
Figure 7. Down-regulation of Rfng and overexpression of Lfng or Mfng decreased their ability to promote Th2 subsets but elevated the ability to promote Th1 subsets.
A, Real-time PCR analysis was performed to detect the IL-4, IL-5, IFN-γ, IL-12, T-bet, GATA-3 levels in SiRNA interference CD4+T cells. Blank-treated results were taken as 1. Results are from three independent experiments. The data for each group are expressed as means±SEM. *p<0.05, **p<0.01, ***p<0.001, significant differences between SiRNA-Rfng group and SiRNA-scramble group (NC), mock control group or blank group. B, the IL-4, IL-5, IFN-γ, IL-12, T-bet, GATA-3 mRNA levels of Lfng plasmid group or Mfng plamid group were determined by real-time PCR analysis. *p<0.05, **p<0.01, significant differences between Lfng (Mfng) plasmid group and pEGFP-N1 group (NC) or blank control group. C and D, the IL-4, IL-5, IFN-γ, IL-12 concentrations in supernatants were determined by ELISA analysis. The data for each group are expressed as means±SEM. *p<0.05.

