
Figure 1. Effects of OroA on LPS-induced changes of the circulating WBC and plasma TNF-α level in the rats.
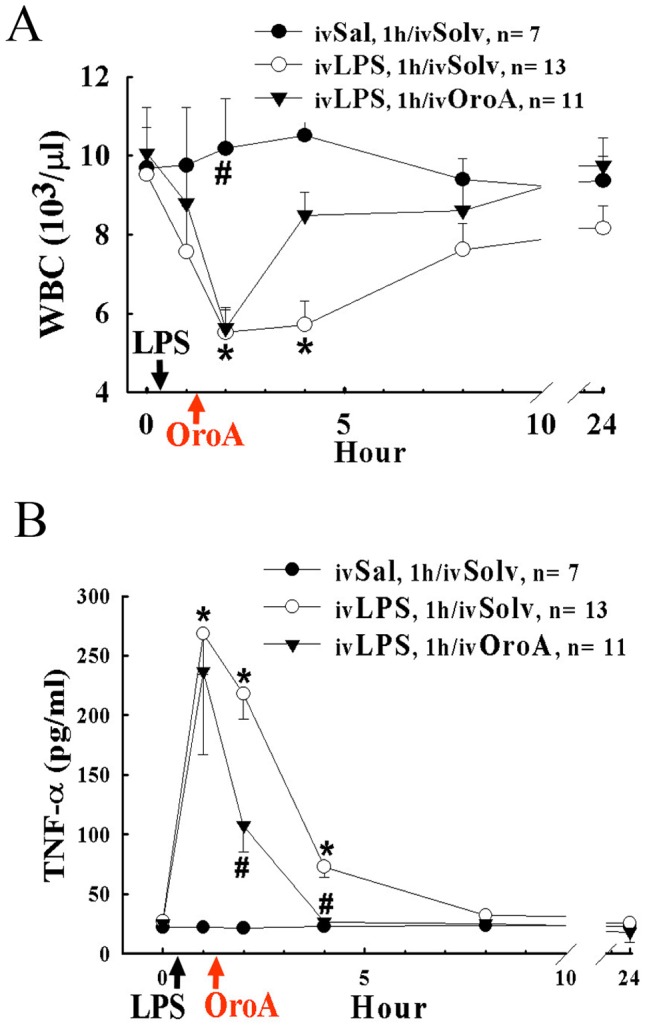
OroA (15 mg/kg, iv) was administered 1 hr and examined 24 hrs after LPS treatment (10 mg/kg, iv) (Panels A and B). Normal saline (Sal) or Solvent (Solv, normal saline plus Tween 80 at 9∶1 ratio) was administered as controls. Black arrow indicates LPS treatment and red arrow OroA post-treatment. Data represent means±SEM. *P<0.05 indicates significant difference from the control, and #P<0.05 indicates significantly different from the LPS alone group. n indicates the number of experiments.