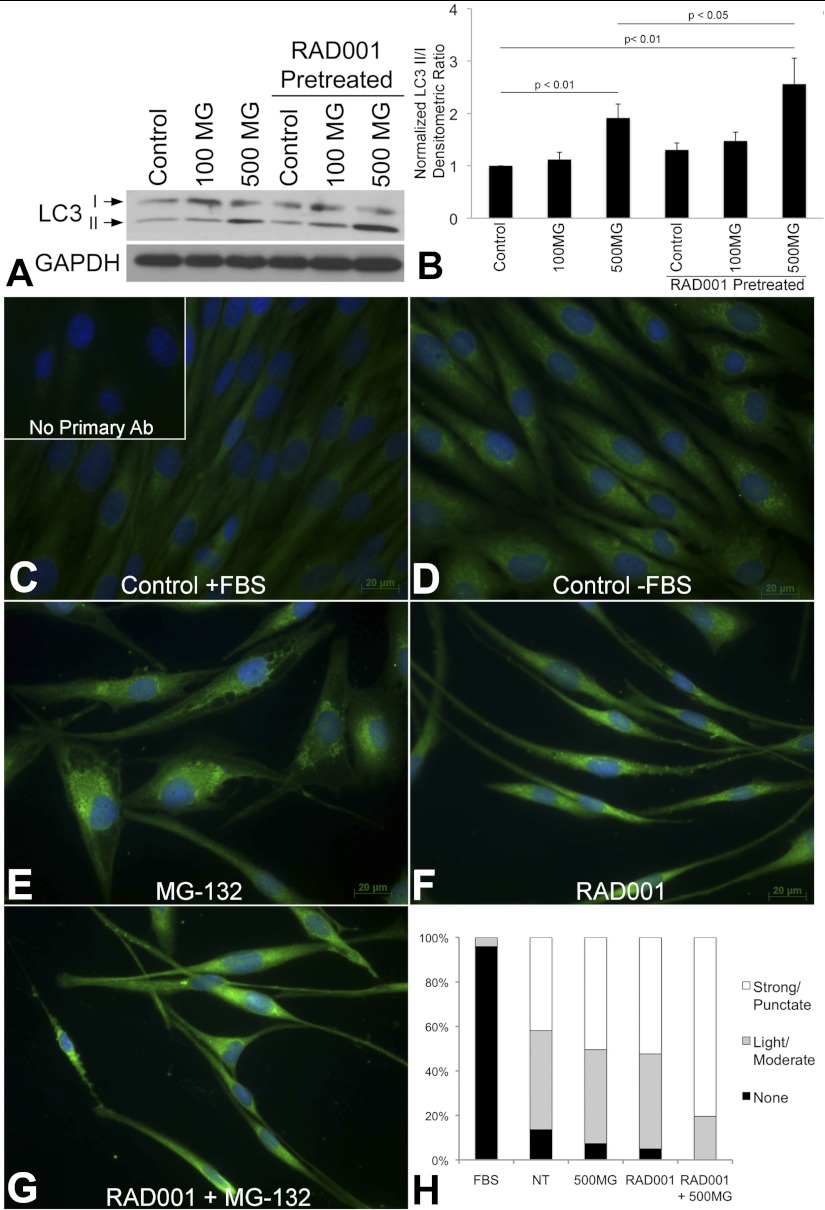
Fig. 8.
A: Western blot of LC3 I and II in TRI102 cells given no treatment, 100 nM or 500 nM MG-132 (8 h) with and without 20 nM RAD001 pretreatment (72 h) in serum free conditions (n = 7). B: graph depicting densitometric analysis. C–G: immunofluorescence images of TRI102 cells stained for LC3. C: control with FBS; inset: no primary antibody negative control. D: control, serum free for 72 h. E: 500 nM MG-132 for 8 h, serum free 72 h. F: 20 nM RAD001 pretreatment for 72 h, serum free 72 h. G: 20 nM RAD001 pretreatment for 72 h, 500 nM MG-132 for final 8 h, serum free 72 h. H: graph depicting percentage of TRI102 cells with LC3 staining patterns of “None,” “Light/Moderate,” or “Strong/Punctate” given the aforementioned treatments; 175 to 260 individual cells in randomly selected fields from 6 separate experiments were evaluated separately by 2 investigators (B. J. Siroky, unblinded and J. J. Bissler, blinded) with a correlation coefficient of 0.992 between data sets.

