Fig. 9.
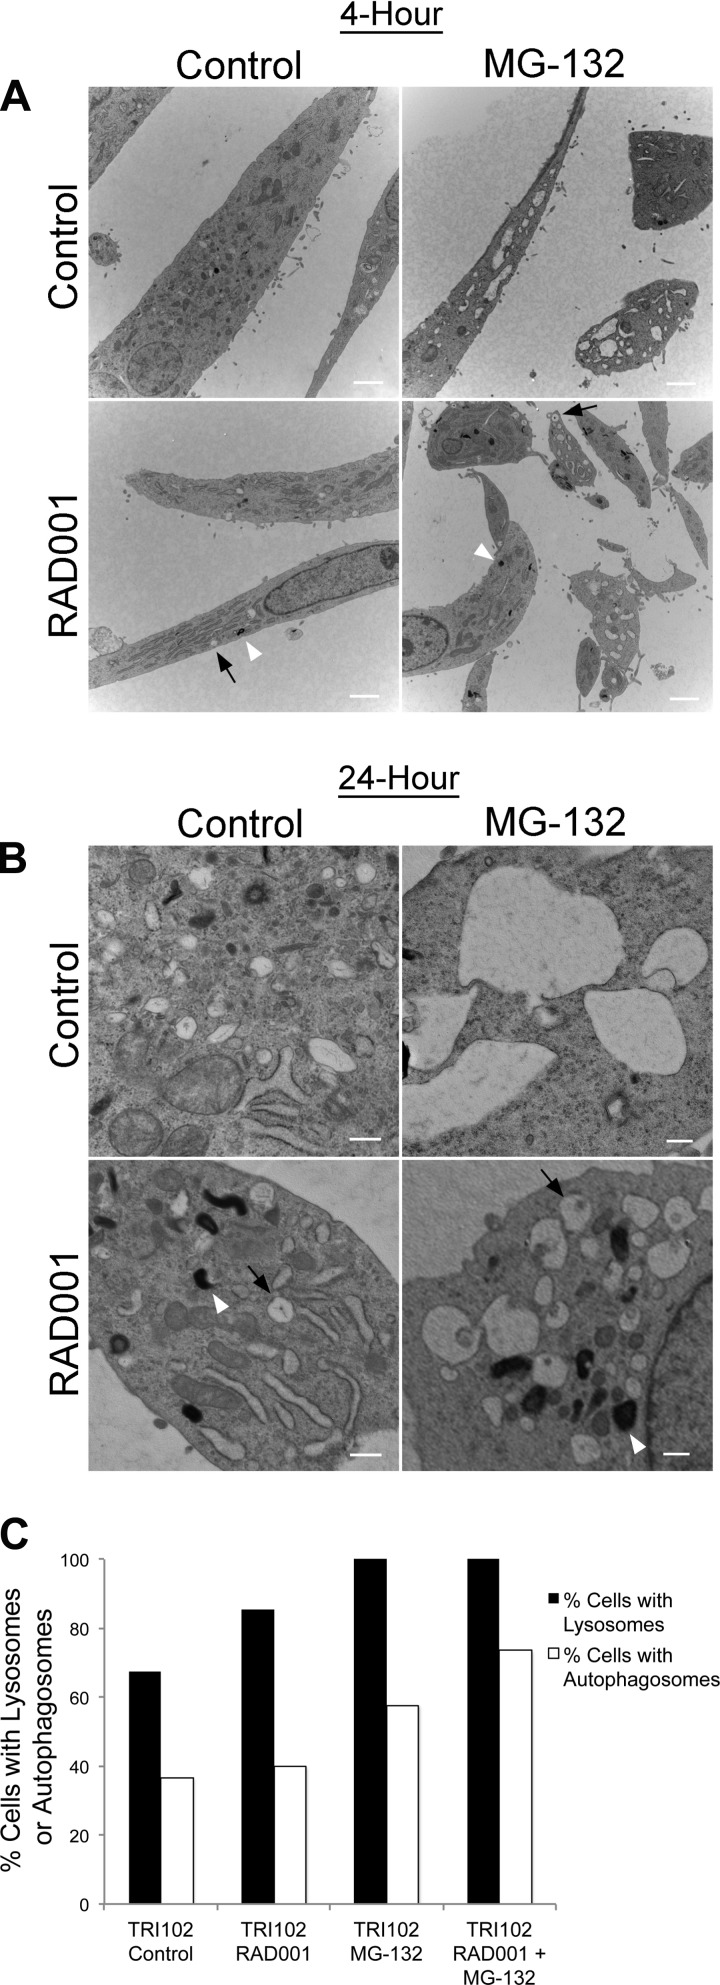
Electron micrographs of TRI102 cells treated with RAD001 (20 nM) and/or MG-132 (500 nM) for 4 h (A) or 24 h (B). A: images are lower magnification (white bars = 2 μm) and demonstrate vacuole formation with MG-132 treatment that is attenuated with RAD001 pretreatment. Electron dense lysosomes (white arrowheads) and autophagosomes surrounding partially digested cellular material (black arrows) are present in RAD001-treated cells, but appear more abundant in RAD001/MG-132 treated groups. B: images are higher magnification (white bars = 500 nm) and demonstrate similar findings. C: graph depicting the percentage of TRI102 cells expressing lysosomes and autophagosomes after 24 h of each indicated treatment. For each group, ≥50 cells were examined from 3 different experiments.

