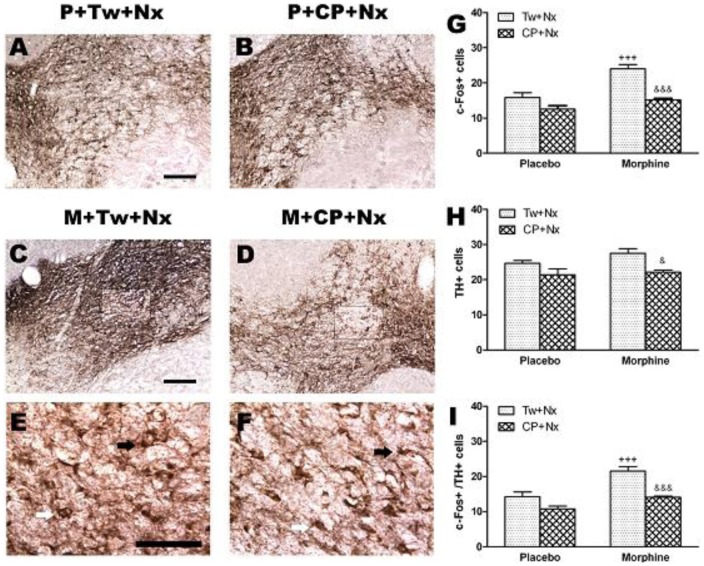
Figure 5. Photographs (A,B,C,D,E,F) represent TH positive neurons coexpressing c-Fos in the ventral tegmental area (VTA) 60 min after naloxone (Nx, N) administration to placebo (P) or morphine (M) dependent rats pretreated with Tween 80 (Tw) or CP-154,526 (20 mg/kg, i.p., CP).
Black arrows: c-Fos+/TH+ neurons; white arrows: c-Fos-/TH+ neurons (E,F). Quantitative analysis of the number c-Fos+, TH+ or c-Fos +/TH+ neurons (G,H,I). Data are expressed as the mean ± SEM (n = 6–7). +++p<0.001 versus the placebo group injected with Tw+Nx; &p<0.05, &&&p<0.001 versus morphine+Tw+Nx.

