Fig. 3.
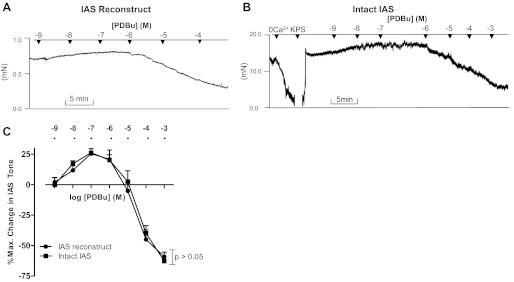
A and B: tracings showing the effects of IAS reconstructs and intact IAS to phorbol 12,13-dibutyrate (PDBu). In the tracing shown here as well as in Figs. 4B and 5B, the effect of 0 Ca2+ determined the basal tone in the IAS and percent maximal relaxation. C: quantitative data showing resemblance of the PDBu effect in intact IAS with the IAS reconstructs, as the two curves obtained from the IAS reconstructs and intact IAS are not significantly different from each other (P > 0.05; n = 5).

