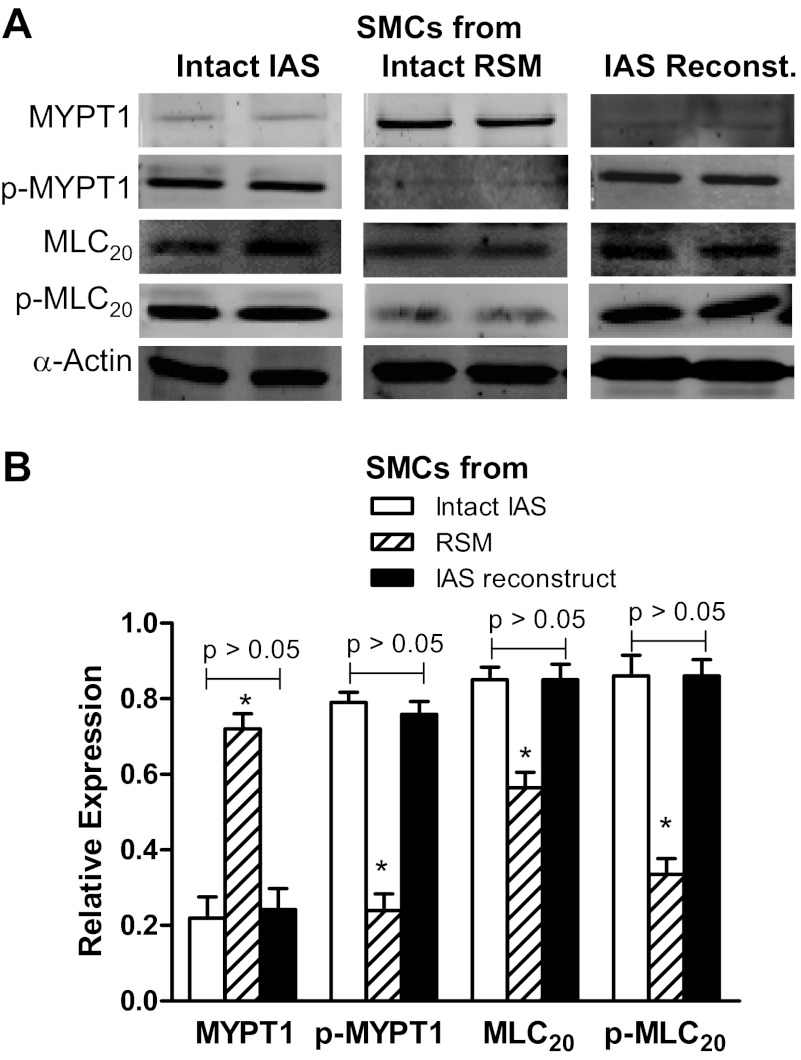
Fig. 7.
A: WB showing relative expression of MYPT1, p-MYPT1, p-20-kDa myosin light chain (MLC20), and MLC20 in the SMCs isolated from intact IAS, intact RSM, and the IAS reconstructs. B: quantitative data for these signal transduction proteins shows higher expression levels of these proteins in the IAS SMCs with the exception of MYPT1 (*P < 0.05; n = 5). The expression levels of MYPT1 were significantly lower (*P < 0 .05; n = 5) in the cells from intact IAS and the reconstructs compared with those from intact RSM.

