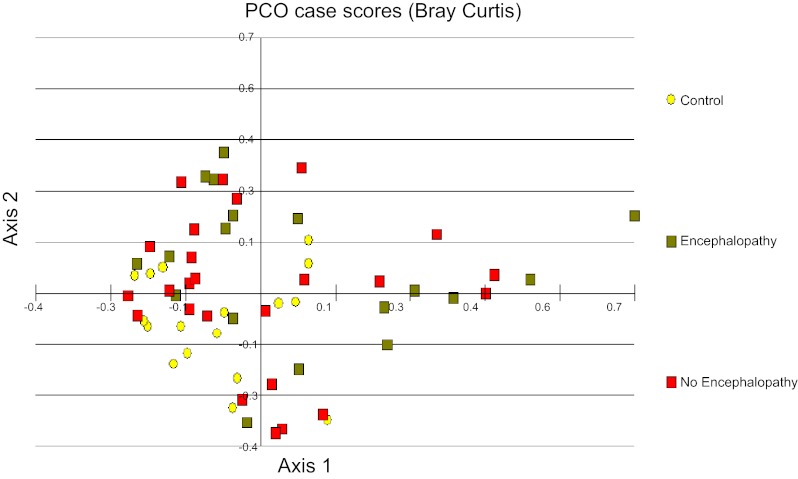
Fig. 1.
Principal component analysis (PCO) of sigmoid mucosal microbiome between controls and patients with and without hepatic encephalopathy (HE). The first principal component accounts for 19% of the variance and the second component accounts for 17% of the variance for a total of 36% of the variance. We found significant clustering of the controls with each other. Additionally, the no-HE patients cluster around the controls whereas HE patients were scattered further from the central control cluster. Yellow: controls; red: no hepatic encephalopathy; green: hepatic encephalopathy patients.

