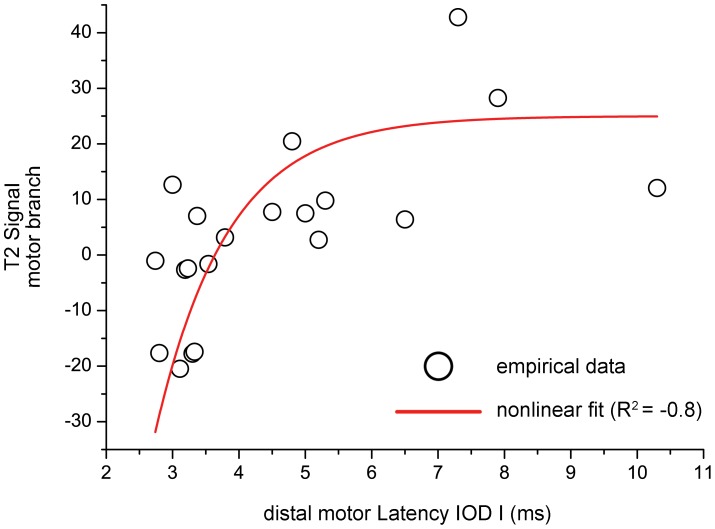
Figure 4. Correlation between deep motor branch T2-signal (y-axis) and its electrical conduction time in ms (x-axis).
Electrical conduction time through the deep motor branch was measured as distal motor latency to its most distal target muscle which is the first dorsal interosseus muscle (IOD I). Note how the empirical data (black dots) strongly correlate (R2 = −0.8; p<0.001) in a non-linear fashion (non-linear fit of asymptotic growth, red dashed line). This finding indicates that nerve T2-signal and electrical nerve conduction show a distinctive behavior under physiological and pathological condition, in that the former exhibits its largest dynamic range near the normative reference value of dml IOD I (which is given in the literature at 3–5 ms), and that electrical conduction exhibits its largest dynamic range in severe pathological states (>5 ms). This may point toward a strong diagnostic value of nerve T2-signal as a novel marker for the early detection of nerve injury.

