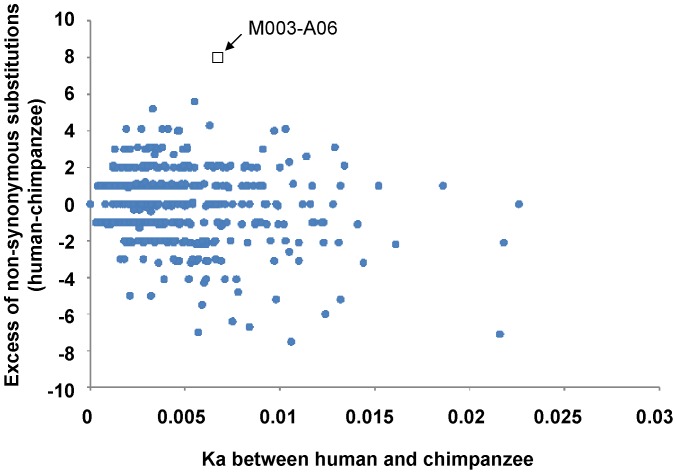
Figure 1. Plot of the excess of nonsynonymous substitutions between human and chimpanzee against Ka.
The Ka values (X-axis) and the numbers of the excess nonsynonymous substitutions (Y-axis) between human and chimpanzee for 1,668 brain expressed genes were estimated by the maximum likelihood method implemented in PAML and plotted. The excess was calculated as [(number of changes in human) - (number of changes in chimpanzee)]. Thus, a positive value indicates more changes in the human lineage than in the chimpanzee lineage and a negative value means more changes in the chimpanzee lineage. The arrow points to the gene M003-A06, which has the highest number of excess nonsynonymous substitutions in the human lineage.

