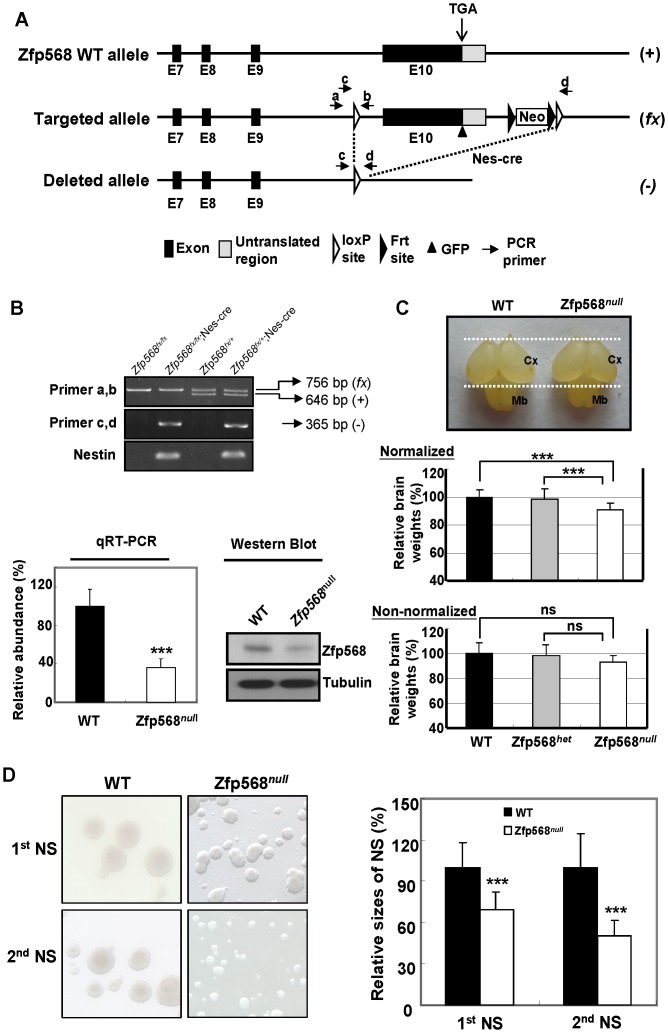
Figure 5. Targeted disruption of the mouse Zfp568 gene in the neural stem cells.
(A) Targeting strategy. Exon 10 (E10) of Zfp568 was replaced with a “floxed” fragment containing exon 10 followed by an frt-flanking neo cassette. Exon 10 was removed by Nestin-promoter-driven Cre recombinase from the Nes-cre mice. The wild-type, targeted, and deleted alleles are labeled as (+), (fx), and (−), respectively, on the right sides of their physical maps. The genotypes of mice carrying the different alleles were validated by PCR (primer sets a/b and c/d) of their genomic DNA. (B) Targeted disruption of Zfp568. Top panel, PCR analysis of the offsprings from crosses of the Zfp568fx/+;Nes-cre male mice with the Zfp568fx/fx females. Primers a and b were used to differentiate the wild-type (+) and the targeted (fx) alleles. Primers c and d were used to detect the deleted fragment as driven by Nes-cre. Lower left panel, quantitative RT-PCR analysis of the level of Zfp568 mRNA in the E12.5 head samples of the wild-type (Zfp568fx/+ or Zfp568fx/fx). The abundance of the Zfp568 mRNA is relative to that of the GAPDH mRNA. The level of the Zfp568 mRNA from the wild-type E12.5 fetal head is given the value of 100%. Lower right panel, Western blot analysis of the E12.5 fetal head of wild-type (WT) and Zfp568fx/fx;Nes-cre (Zfp568null) mice. (C) Representative photos of the P0 (postnatal day 0) brains of WT and Zfp568null (top panel), and the relative P0 brain weights of the WT, the heterozygous Zfp568het (Zfp568fx/+;Nes-cre), and Zfp568null mutant mice (normalized, middle panel; non-normalized, bottom panel). Dashed lines delimit the rostrocaudal extent of the WT cerebral cortex (Cx) and midbrain (Mb). The average brain weight of the WT P0 mice was set as 100%. For the normalized data set (middle panel), the brain weight of each mouse was normalized by its body weight. n = 29 for WT, 15 for Zfp568het, and 19 for Zfp568null. ***, p<0.005; ns, not significant. Note that the relatively large sample sizes have overcome the seemingly large standard deviations in the normalized data set (middle panel). Also note that the average of the non-normalized brain weights of the Zfp568null mice was also smaller than either Zfp568het or WT (0.065 g in comparison to 0.069 g and 0.070 g, respectively). But these differences were statistically insignificant likely due to the fluctuations of the brain weights in the neonatal mice (P0) of different litters. (D) Left panels, photos of the primary (1st NS) and secondary (2nd NS) neurospheres cultured from the WT and Zfp568null P0 brains. The averages of the diameters of both the primary and secondary neurospheres were calculated and shown in the right panel. The averages of the WT neurospheres (filled bars) are set as 100%; *** p<0.005.

