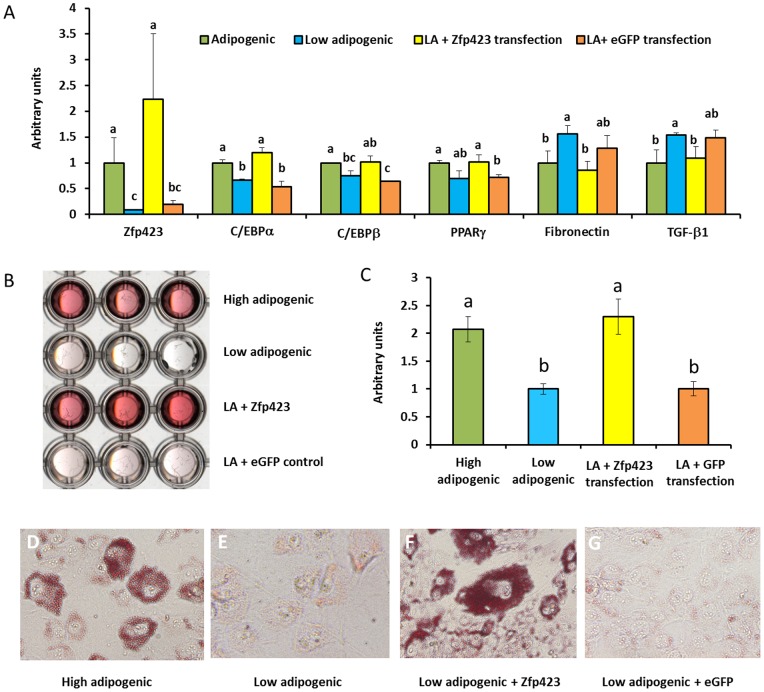
Figure 6. Adipogenic differentiation of cloned low adipogenic cells after Zfp423 transfection.
A) adipogenic gene expression in control (eGFP transfected low adipogenic cells), Zfp423 transfected low adipogenic cells, and cells without transfection. B) Transmissive scanning of Oil-Red-O stained cells. C) Quantification of Oil-Red-O staining by absorbance measurement at 520 nm. D) 100× magnified image of high adipogenic cells. E) 100× magnified image of low adipogenic cells. F) 100× magnified image of Zfp423 transfected low adipogenic cells. G) 100× magnified image of eGFP tranfected low adipogenic cells. (abMeans bearing different superscripts indicate significant difference, P<0.05, Mean ± SE; n = 3).

