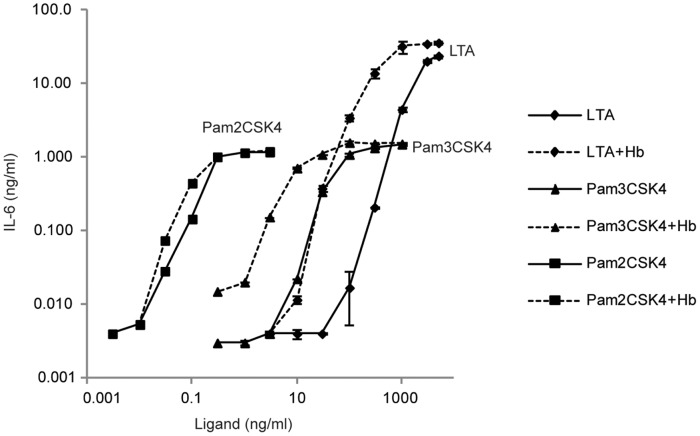
Figure 1. Macrophage dose response curves for IL-6 secretion induced by TLR2 ligands with and without Hb. HeNC2 cells were stimulated with various amounts of LTA (diamonds), Pam3CSK4 (triangles) or Pam2CSK4 (squares) with or without Hb (50 µg/ml, dashed lines or solid lines, respectively) for 18 hours at 37°C.
Levels of IL-6 in the supernatants were analyzed by ELISA. Data are plotted on a log-log scale. These results denote mean +/− standard error (n = 3) and are representative of three independent experiments.

