
Figure 4. Color-coded dependence of achieved improvement in ROC AUC values obtained by the energy gap on original ROC AUC values obtained by docking score.
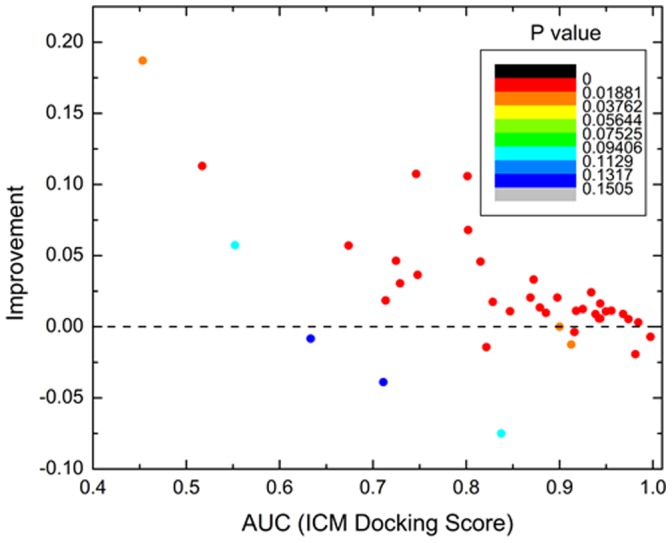
Each dot represents one protein domain. The dots are colored in different colors spread evenly among P-values from 0.00 to 1.00 (smallest P-values, that is, most statistically significant are red, highest P-values are blue). Overall improvement is achieved in 77% of cases in binder/decoy ligand discrimination. In 14% of cases the energy gap and the docking score performed equally. The improvement is particularly high (up to 0.19 AUC units) for the previously problematic cases with original AUC value below 0.9. In fact for these cases we obtained improvement in 83% of the proteins domains.