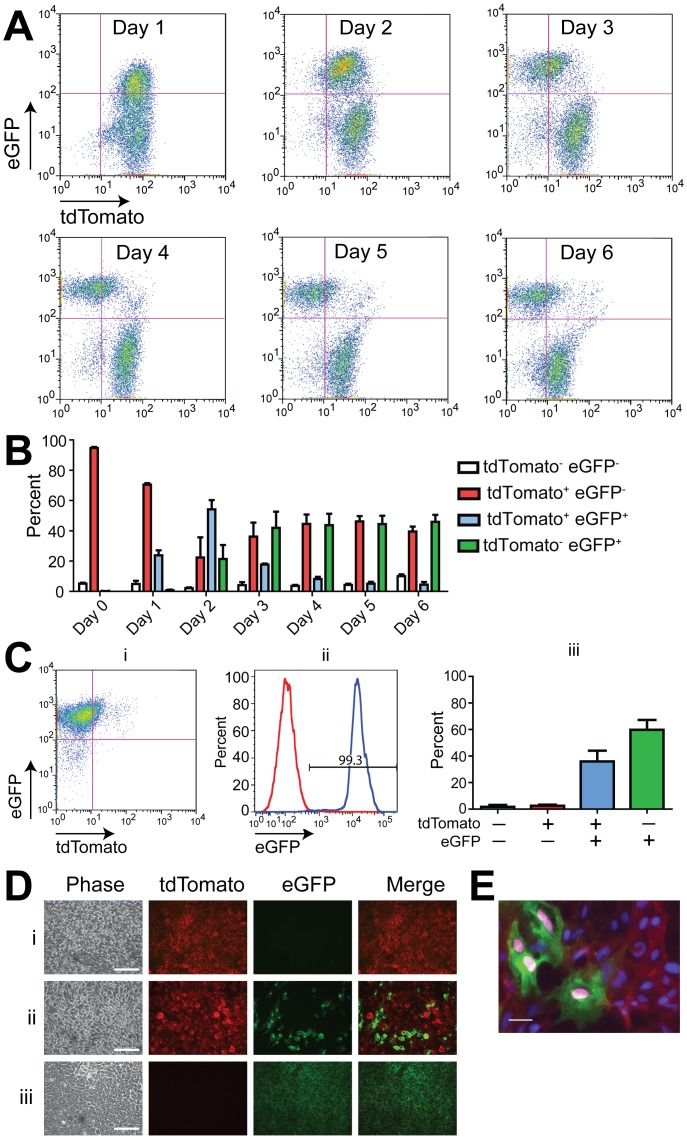
Figure 3. Cre expression mediates a fluorescence switch in undifferentiated mTmG-2a-Puro floxed reporter hESCs.
(A) Flow cytometry showing changing numbers of tdTomato+ and eGFP+ RUES2 mTmG-2a-Puro cells at various timepoints after transduction with an EF1α-Cre lentivirus. (B) Quantitation of the fluorescence switch shown in panel A (n = 3 biological replicates). (C) Scatter plot of undifferentiated mTmG-2a-Puro cells treated with EF1α-Cre lentivirus and then selected with puromycin for 48 hours. Note that the resultant cultures were >99% eGFP+ by flow cytometry (i). Comparison of untreated (red) and EF1α-Cre treated, puromycin selected (blue) undifferentiated mTmG-2a-Puro cells (ii). Quantitation of flow cytometry data from three independent experiments in which cells were transduced with EF1α-Cre and puromycin selected (iii). (D) Phase contrast and fluorescent photomicrographs of undifferentiated mTmG-2a-Puro cells (i), mTmG-2a-Puro cells treated with EF1α-Cre lentivirus (ii), and mTmG-2a-Puro cells treated with EF1α-Cre and selected with puromycin (iii). Scale bars are 50 µm. Error bars represent +/− one standard error of the mean. (E) mTmG-2a-Puro cells transduced with EF1α-Cre lentivirus were immunostained with an anti-Cre recombinase antibody. Note that Cre (magenta) co-localizes only with eGFP+ cell nuclei. Scale bar is 10 µm.

