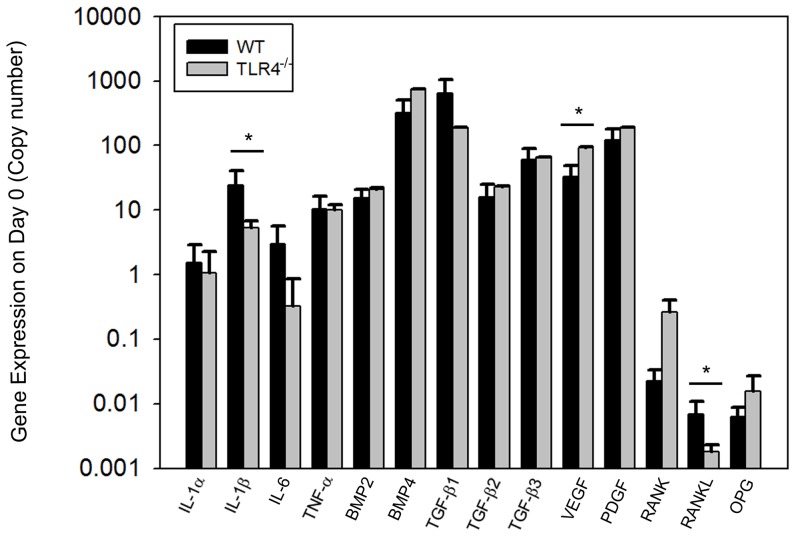
Figure 6. Graph showing quantitative gene expression on day 0 (untreated control) bone tissue.
Siginificant differences were identified in the expression of IL-1β,VEGF and RANKL between the two groups. IL-1β and RANKL expression were higher in WT mice and VEGF expression was higher in TLR4−/− mice on day 0 (mean +/−SEM; n = 5 to 7; *p<0.05).

